Product Experimentation Pitfalls, Post #2: Experimenting Without Enough Traffic
This is the second post in our Product Experimentation Pitfalls blog series written by Optimizely’s Director of Product Management, Jon Noronha. See here for more information on this 5-part series. An experiment is like a metal detector. When there’s valuable treasure close to the surface, it’s an incredible tool that can lead you straight to the gold.

Jon Noronha
An experiment is like a metal detector. When there’s valuable treasure close to the surface, it’s an incredible tool that can lead you straight to the gold. But to have any success, you have to have a powerful enough detector to pick up the signals. Otherwise, a well-meaning attempt at experimentation will just lead you in circles.
Experimenting in products can be especially hard, because they often get less traffic than a marketing or e-commerce funnel. At Optimizely, we run hundreds of experiments on our landing pages and sign-up flow, but even we have to be thoughtful about the tests we run within our product. As a B2B application, we have to be careful about choosing the right metrics and running tests that have the power to move them.
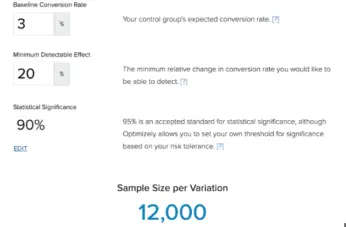
How much traffic is enough? I recommend playing with a calculator like this one to get a feel for the numbers. In general, you want to be able to send thousands of users into each of your variations. With fewer, you’ll only be able to catch the most drastic effects. With more, you can pick up on subtler behavior changes or get answers much more quickly.
My rough guideline is this: if you have less than 10,000 monthly active users, don’t even bother with a traditional A/B test. You’re better off doing qualitative research. The feedback you’ll get from a one-on-one conversation is infinitely more valuable than the low-powered signals you’ll get from any A/B test.
In this case, you can also still get value from a gradual rollout, where you ramp up traffic incrementally and monitor metrics to make sure nothing breaks. For a rollout, you can lower your significance bounds and raise your minimum detectable effect to see problems with even 1,000 users.
Conversely, if you have more than 10,000 users a month, you should absolutely be experimenting. With millions of visitors you can go crazy and test every detail of every interaction, but even with substantially less traffic you can get meaningful insights – and you do your users a disservice by ignoring that data.
When testing with low traffic, focus on making extreme changes and finding lightweight proxies for larger charges. My favorite example is inverted performance testing. Let’s say you’re considering redesigning a service to make it 5% faster, at the cost of several weeks of engineering. Before you embark on that journey, you should have a clear idea of how much that 5% performance is costing you in conversions and retention. But how can you test the impact without actually building it? Try going the other way. It’s hard to make your site faster, but very easy to make it slower. So try artificially slowing down your site by 5% instead, and see how much conversions drop. If you don’t get a clear signal, go even further – try slowing it down by 10% and 20% in different variations. You can measure the precise effect of these changes, and use them to plot the curve of performance vs. whatever underlying metrics you care about – all with an eye to forecasting the value of improving it.
As that example shows, there’s a tremendous benefit to testing multiple variations and pushing them to extremes beyond your comfort zone. Even when you’d never ship these extreme variants, they force you to be creative, and they generate much more information than you’d otherwise get from a conservative rollout.
Optimizely’s data shows that you can actually double your win rate by testing four treatments instead of just one, from 14% to 28% on average. You might be tempted to skip these variants with low traffic, but it’s worth it to take your time. And you can mitigate much of this extra traffic cost by using techniques like adaptive sampling to rebalance traffic over the course of an experiment.
All in all, we hope some of these tips are helpful as you’re planning your experiments. Don’t forget to test with enough traffic and determine what your key metrics are.
About the author