How to Avoid Building the Wrong Product? Make Your Product Roadmap Your Experimentation Roadmap
We often hear that product development teams don’t have an experiment backlog or that they struggle to come up with experiment ideas.

Almost certainly, though, you have a product roadmap. This list of problem-solution pairs includes the features that will certainly help you defeat the competition.
Well, maybe. No matter how much data analysis, user feedback and competitive research you conduct, there’s always a chance you get it wrong. And getting it wrong comes in two forms:
- Building the wrong product, and
- Building the product wrong.
To avoid these outcomes at Optimizely, we use an experiment-driven product development cycle. To illustrate this journey, let’s walk through the experimentation process that initiated and fueled the launch of one of our machine learning features – Stats Accelerator.
Briefly, Stats Accelerator uses machine learning algorithms to automatically adjust A/B test traffic allocation across variations to help the test reach statistical significance in shorter time. This helps users make sound business decisions faster.
Reducing time to statistical significance is a complex problem. It forced us to make a lot of product, design, and engineering decisions. Experimentation was at the center of each one. We may not have built the feature or may have built it very differently if we had not used experimentation.
Here’s what the product development cycle looked like:
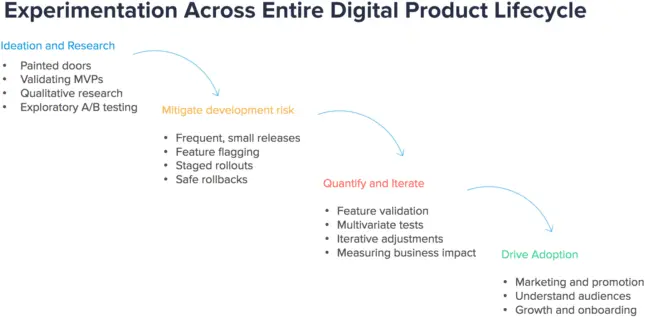
Ideation and Research
At first, we had plenty of qualitative feedback suggesting that our customers’ run fewer tests than they’d like to because of the lengthy time it took to reach statistical significance. “If only I could reach stat sig faster” was the common refrain. If an A/B Test reaches statistical significance, it means the difference in visitor behavior observed, like an increased click through rate, was likely caused by the test variation and not due to pure random chance. In other words, the user can be confident that the A/B Test influenced visitors and can make a decision on what to do with that insight.
Our team had initial ideas for how reduce the time to significance, but we first wanted to quantitatively measure how important this problem really was before committing.
So we ran a “Painted Door” test to validate customer demand. A “Painted Door” test creates a minimal user experience that mimics a full feature set and measures the number of users who engage with it. Behind the painted door, you may include a survey or some other mechanism for collecting additional qualitative data.
In our case, we wanted to know if users would be more likely to create and start A/B tests if they thought they’d reach statistical conclusions more quickly. Here’s what the variation looked like:
Variation A: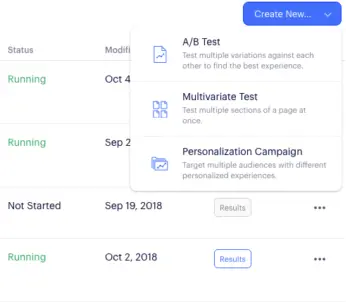
Variation B: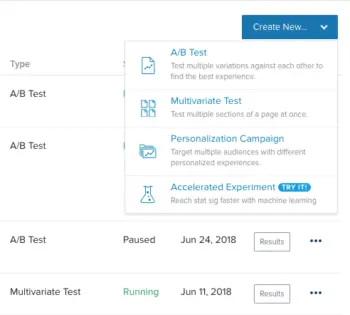
What did we learn? Based on the number of users who engaged with the painted door, we saw a clear signal that this was worth further exploration.
Critically, this gave us the confidence to formally slot this feature development into our product roadmap.
Next, we started building prototypes and running simulations. A unique part of Stats Accelerator and other machine-learning features is that there is not only UX and engineering design to figure out, there is also a big math problem to solve.
As simple as that might look (just kidding), making sure this formula benefited customers as much as possible required a lot of tweaking. As with other machine learning models, we had to tune the hyper-parameters, which control things like how quickly traffic is pushed to each variation and how to handle fluctuating conversion rates.
To tune the model, you guessed it, we ran some experiments. When we wrote the machine learning models in code, we defined the algorithm’s most impactful parameters as Feature Variables in Optimizely Full Stack. This allowed us to test different values for these parameters without having to dive back into the code. Specifically, we leveraged the Java SDK and synthetic traffic resembling historical site data to run Full Stack Feature Tests measuring of each variable adjustment.
Below is what our Feature Test configuration looked like in the Optimizely UI. One iteration was to test an “aggressive” algorithm against a “passive” one. The parameters we defined as Variables were forced_exploration, aggression_level, and fluctuation_sensitivity. Each of these impacts how quickly the algorithm can help tests reach significance as well as crucial statistical outcomes like error rates.
Tuning the model using A/B Tests helped us to understand which variables caused the biggest reduction in time to statistical significance, without sacrificing rigor.
Indeed, Stats Accelerated experiments were rigorous and fast…really fast.
With our algorithm polished and the confidence that we were not building the wrong product, we left our laboratory and began the engineering development.
Mitigate Development Risk
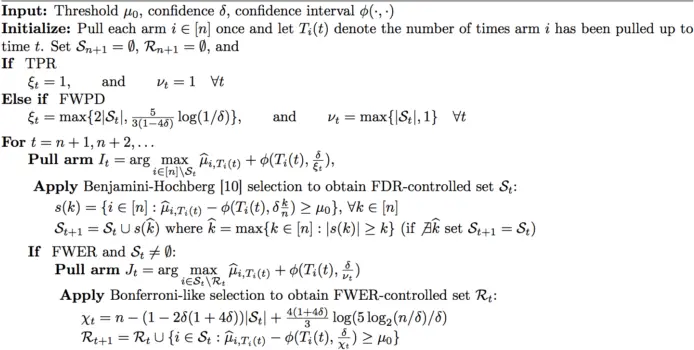
As with any release, there is always a chance you ship bad code. It’s possible to build the product wrong. To mitigate our risk, we decided to build Stats Accelerator behind a Full Stack Feature Flag (“bandits-v2” in the image below). Then, we gradually rolled it out – first to a set of whitelisted customers in our beta, then to an increasing percentage of eligible accounts.
The Feature Rollout helped us validate engineering quality and our backend infrastructure’s ability to scale and support the load. The best part was that we could control this percentage right there in the UI without a code deploy.
After a few weeks, we were at 100% and Stats Accelerator was officially Generally Available! Celebration ensued.
But of course, a feature is never finished. There’s always room to iterate, to improve.
Quantify, Iterate and Drive Adoption
Like a tennis swing, success depends on the follow through. Initially, success means adoption. To drive adoption, we run promotions targeted at specific groups of users, using Optimizely’s personalization campaigns. The goal is to help customers of different type understand the value of Stats Accelerator.
The experience is delivered to users
- Who are working on an A/B Test that does not have Stats Accelerator enabled yet, and
- Whose accounts are eligible for Stats Accelerator.
Users who don’t have access are targeted with an upsell message. This type of targeting and user experience is easy to set up and launch without engineering resources using a platform like Optimizely X Personalization.
Again, we’re seeking to increase the number of experiments started with Stats Accelerator enabled. While at this point we know we didn’t build the wrong product, these campaigns help us make sure we are even more right. The increased usage also fuels our customer feedback pipeline.
Conclusion
We focused on a multi-faceted feature in this post, but the process can be applied to any problem or new feature on your roadmap. Leveraging experimentation in each of the four steps can help you avoid building the wrong product and building the product wrong.
Over time, you’ll notice the title of this post should be reversed. That is, your experimentation roadmap is your product roadmap, not the other way around. Taking this mindset will improve your development velocity, code quality, and of course business outcomes in the long run.