Ask the Experimentation Expert: Stop Using Revenue as your Primary Metric
As we work with our customers to help them understand the results and learnings from an experiment, one of the main questions we hear is “Why am I not reaching significance?” or, more specifically, “Why is this experiment inconclusive?” When I hear this question, my first check is to look at what metrics are set and what is the related success criteria across those metrics for improving conversion rate.

Alek Toumert

As we work with our customers to help them understand the results and learnings from an experiment, one of the main questions we hear is “Why am I not reaching significance?” or, more specifically, “Why is this experiment inconclusive?” When I hear this question, my first check is to look at what metrics are set within Optimizely to measure the success of an experiment. And most importantly what is set as the primary metric of success? This primary metric is meant to be the metric weighted the heaviest amongst the other experiment metrics to declare an experiment a winner. This is no different than most business decisions! A leading metric with supporting right metrics.
The work to find conclusive results starts way before pressing start on your experiment. It starts before doing a results analysis. It starts before the test design. It starts as you identify the metrics you can influence through experimentation and understanding how those metrics interact with each other.
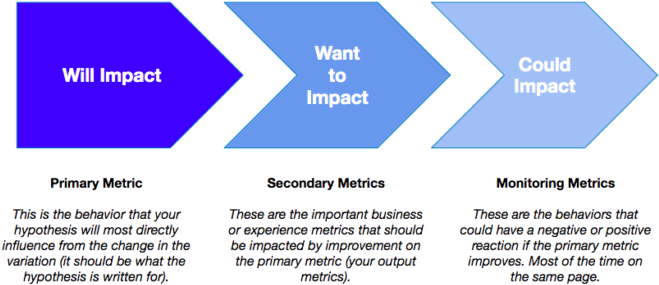
For customer satisfaction, revenue, a higher retention rate and the final conversion(s) are the Key Performance Indicators (KPIs) in focus to improve through experimentation. But other metrics could (and should) be the focus for individual experiments, depending on the customer problem you are looking to solve. The metrics below your most important KPIs may also be the ones closest to where you are experimenting. These metrics are the behaviors you can most confidently measure and improve for an individual experiment. Moving the needle on these behaviors will have a downstream impact on those top-line KPIs.
If you only focus on revenue as the primary metric for all experiments in the short term, you are sure to lose out on wins, learnings, and opportunities to iterate towards impacting revenue. You will undoubtedly make decisions and call experiments unsuccessful when in fact they positively impact user behaviors while influencing revenue in the long run. If you don’t set up your experiments properly to uncover the impact of these behaviors you are also diverting from learning what impacts revenue.
But wait. We only care about driving revenue from a/b testing. Why wouldn’t we measure success by revenue?
You should measure revenue! In fact, you should measure it for every experiment as a secondary metric if that’s important to your business! And use that in balance with other metrics to determine success. However, what you can’t control for every experiment is the impact that it will directly have on revenue and customer lifetime value.
Your metric definition for an individual experiment should fit into these three buckets:
Let’s imagine you have seen dropping engagement, average order value and a lower number of active users on your homepage, which is an issue because it’s the main entry point for your ecommerce site. A hypothesis you have may be:
‘If our product marketing team used a carousel instead of a static hero image, then we will increase purchases because we are providing our users more offers and product messaging upon entry.’
You need to consider that there are a lot of steps/messages/behaviors, and other influences (think external to your site even!) that happen for your users between that change and the final conversion that you are not controlling for. As an example, there could be a promotional ad campaign that drove a user arrived to the homepage that pull a number of users away from converting later on due to mismatched messaging later in the path towards purchasing.
The bottom line is your primary metric (and the main metric in your hypothesis) should always be the behavior closest to the change you are making in the variation you are employing. The hypothesis should actually read:
‘If we use a carousel instead of a static hero image, then we will increase hero real estate clicks and product page views because we are providing our users more offers and a new product messaging upon entry.’
Now let’s imagine a different scenario. You’ve optimized the top part of your ecommerce funnel well. But you’re struggling in the checkout step now. Your hypothesis is:
‘If we collapsed form field sections on the checkout page, then we will increase purchases because we are presenting an indication of all the info we will require from users above-the-fold from the section titles’
This maps well to the metric flow chart above! Since we are experimenting at the last step (the only purpose of that page is to convert users), using purchases or revenue as the primary metric makes sense. It’s the behavior you are most likely to impact from the changes you are making in the variation.
But for our up-the-funnel (those further away from purchase or your final conversion) experiments, should we not expect to see revenue impact?
“Should” may not be the right word. We always hope that revenue will be impacted by your prioritized experiments. There just needs to be an understanding that for every experiment you may not be able to confidently measure direct impact on revenue.
However if you can progress those behaviors that ladder up and lead your users closer to that final conversion that drives revenue, you are impacting revenue. If you measure those leading behaviors first and make statistically significant improvements on those, you can continue to shift your focus to experiments that are closer to revenue.
That makes sense. But again. REVENUE, REVENUE, REVENUE.
Alright fair. The above is conceptual. But we looked across all customer experiments and actually saw this to be true! We found that when monthly recurring revenue is set as the primary metric in Optimizely, it reached the project’s statistical significance level only 10% of the time compared to when all other goal types (page views events, click events, custom events) are set as the primary metric. Even though we want to maximize revenue in our experimentation, it is not always within our complete control in every experiment, and experiment data backs this up.
The best programs do measure revenue and other important metrics for every experiment to understand the incremental impact of experimentation on those key KPIs.
How should you weigh the primary versus secondary metric(s) for determining individual experiment success?
Good practice in your test planning is to discuss as a group what trade-offs you are willing to make on performance between the total number of primary and secondary metric(s) – in this case revenue. It’s been interesting learning to find that this differs across the industry. Some programs take a statistically significant improvement on the primary metric as the only success factor for an experiment. Some programs state that there must be a statistically significant improvement in secondary metrics (e.g. revenue, purchases) for any experiment to be considered a win.
You can set up a decision framework upfront for an experiment (or for the program at large) to create a consensus approach on how to handle these scenarios. This framework may change over time, but it can increase the speed of decision-making and actions based on results. We recommend using this as often as there are debates on success criteria!
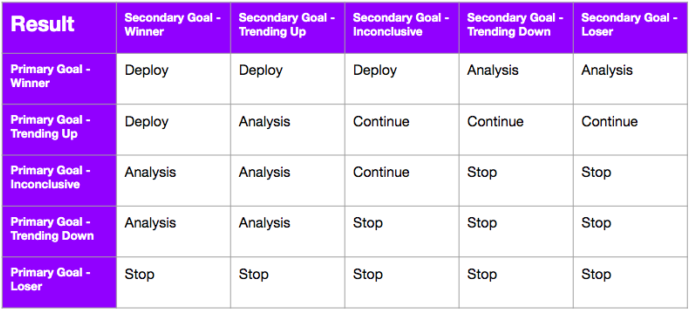
There are two key parts to a best-in-class decision framework: it has a reasonable delta of impact on revenue AND either accepts or rejects that a statistically significant win on the primary metric is necessary. This could be a delta that has both positive and negative boundaries. This is where Optimizely’s confidence intervals come in handy. Using the confidence intervals on the Optimizely results page gives you a clear indication of where “true improvement” will lie in revenue if you implement the winner. Ensure that interval does not expand based on your reasonable delta.
What are other ways we can measure the success of our program?
The most overlooked part of standing up an experimentation program is the measurement imposed on itself. We call these measures ‘operational metrics’ and these look at the overall program versus the specific tests. These business metrics are behaviors that we know are strong indicators of a healthy program. If we believe that our methodology is sound and in turn generates learnings that improve our knowledge of our existing and new customers, these types of metrics are good indicators of success:
- Velocity – The # of experiments started per week, month, quarter, etc.
- Conclusive Rate – The % of experiments reaching a statistically significant state.
- Win Rate – The % of experiments reaching a positive statistically significant state.
- Learning Rate – The % of experiments that created an actionable learning.
- Reusability Rate – The % of experiments that inform other initiatives and business goals.
- Iteration Rate – The % of experiments that are iterated on as a next step.
There are many other operational key metrics you can dream up and these could be sliced by any metadata you are keeping on your program (e.g. type of variation strategy, source of idea, etc.) to illustrate the impact the program is having on your business during a time period.
Remember...
Every experiment is different! You may not follow these principles to a T, but your program should have a strong and consistent point of view on how to define primary metrics to better understand your experiment results and learnings. Let us know how you might approach this differently, what you’ve seen to be a success in defining your experiment metrics, and how you have approached analyzing revenue impact!