5 best practices for server-side A/B testing
With feature rollouts, your application has the ability to simultaneously deliver two different experiences: one with the feature on and another with the feature off.

Asa Schachar

But how do you know which one is better? And how can you use data to determine which is best for your users and the metrics you care about?
An A/B test points you in the right direction. By being precise with how, when, and who is exposed to different feature configurations, you can run a controlled product experiment, get statistically significant data from usage, and be scientific about developing the features that are right for your users, rather than relying on educated guesses.
A/B tests allow you to use objective-truth data to resolve differing options within your organization, accelerates learnings about your customers to outpace competitors, and complements qualitative user research with quantitative data.
But how do you make sure you are configuring your A/B tests to maximize learnings and impact? I got you! In this blog post, I’ll cover 5 best practices for server-side A/B testing, as described in my free ebook Ship Confidently with Progressive Delivery and Experimentation, to ensure you get accurate, trustworthy results. Let’s dive in!
01 Best practice: Capture the right event information for analyzing an A/B test
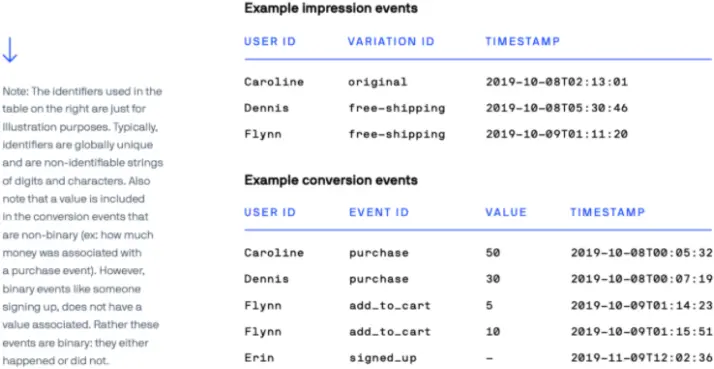
When instrumenting for A/B testing and tracking metrics, it’s important to track both impression and conversion events because each type includes key information about the experiment.
Impression event
An impression event occurs when a user is assigned to a variation of an A/B test. For these events, the following information is useful to send as a payload to an analytics system: an identifier of the user, an identifier of the variation the user was exposed to, and a timestamp of when the user was exposed to the variation. With this information as an event in an analytics system, you can attribute all subsequent actions (or conversion events) that the user takes to being exposed to that specific variation.
When using an experimentation platform like Optimizely, this impression event is automatically sent when delivering the experience of the A/B test.
Conversion event
A conversion event corresponds to the desired outcome of the experiment. Looking at the example metrics above, you could have conversion events for when a user signs up, when a user shares a product, the time it takes a dashboard to load, or when an error occurs while using the product. With conversion events, the following information is useful to send as a payload to an analytics system: an identifier of the user, an identifier of the type of event that happened (ex: signup, share, etc.), and a timestamp.
When using an experimentation platform like Optimizely, you would either instrument your application with tracking calls or forward events from your existing analytics tool for experiment analysis.
02 Best practice: Deterministic experiment bucketing — hashing over Math.Random()
If you’re building an experimentation platform, you may be tempted to rely on a built-in function like Math.random() to randomly bucket users into variations. However, once bucketed, a user should only see their assigned variation for the lifetime of the experiment. Otherwise, it’s impossible to know whether their subsequent behavior can be statistically attributed to that particular variation.
Since Math.random() returns a different number every single time it is called (ie. Math.random() is indeterministic), you’d have to store the resulting variation in order to maintain that variation assignment for a particular user.
Unfortunately, though, storing the result of the bucketing decision forces your platform to be stateful. And having an indeterministic function like Math.random() in your codebase will make it hard to force your application into particular states for manual or automated testing.
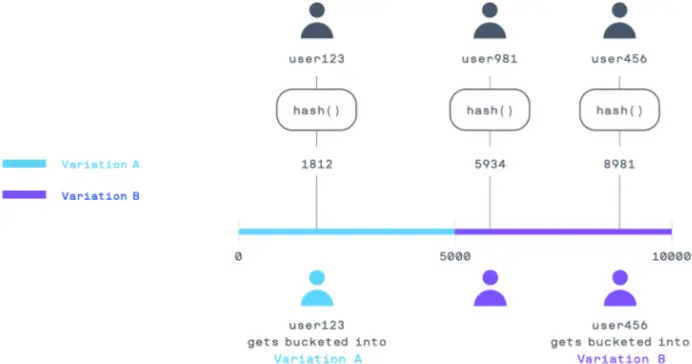
A better approach is to use hashing as a random but deterministic and stateless way of bucketing users. To visualize how hashing can be used for bucketing, let’s represent the traffic to your application as a number line from 0 to 10,000.
For an experiment with two variations of 50% each, the first 5,000 numbers of your number line can correspond to the 50% of your traffic that will get variation A, and the second 5,000 numbers can correspond to the 50% of your traffic that will receive variation B.
The bucketing process is simplified to assigning a number between 0 and 10,000 for each user. Using a hashing function that takes as input the user id (ex: user123) and experiment id (ex: homepage_experiment) and outputs a number between 0 and 10,000, you achieve that numbered assignment for assigning variations:
hash(‘user123’, ‘homepage_experiment’) -> 6756 // variation B
Because of the properties of a good hash function, you are always guaranteed a deterministic but random output given the same inputs, which gives you several benefits:
- Your application runs predictably for a given user
- Automated tests run predictably because the inputs can be controlled
- Your progressive delivery and experimentation platform is stateless by re-evaluating the hashing function at any time rather than storing the result
- A large hashing range like 0 to 10,000 allows assigning traffic granularity at fine increments of 0.01%
- The same pseudo-random bucketing can be used for random phased rollouts
- You can exclude a percentage of traffic from an experiment by excluding a portion of the hashing range
03 Best practice: Use A/B tests for insight on specific metrics
A/B tests make the most sense when you want to test different hypotheses for improving a specific metric. The following are examples of the types of metrics that allow you to run statistically significant A/B tests.
Product metrics: For product improvements
Landing page signups
Ever wonder which landing page would lead to the most signups for your product? During the 2008 presidential campaign, Barack Obama’s optimization team ran several A/B tests to determine the best image of Obama and corresponding button text to put on the landing page of the campaign website. These A/B tested adjustments increased signups and led to $60 million of additional donations from their website.
Referral signups through shares
Want to know which referral program would increase virality of your product the most cost-effectively through sharing? Ride-sharing services like Lyft, Ube often experiment on the amount of money to reward users for bringing other users to their platforms (ex: give $20 to a friend and get $20 yourself). It’s important to get this amount right so the cost of growth doesn’t negatively impact your business in the long term.
Operational metrics: For infrastructure improvements
Latency & throughput
If engineers are debating over which implementation will perform best under real-world conditions, you can gather statistical significance on which solution is more performant with metrics like throughput and latency.
Error rates
If your team is working on a platform or language shift and has a theory that your application will result in fewer errors after the change, then error rates can serve as a metric to determine which platform is more stable.
04 Best practice: A/B/n tests go beyond two variations to test feature configurations
A simple feature flag is just an on-and-off switch that corresponds to the A and B variations of an A/B test. However, feature flags can become more powerful when they expose not only whether the feature is enabled, but also how the feature is configured.
For example, if you were building a new dashboard feature for an email application, you could expose an integer variable that controls the number of emails to show in the dashboard at a time, a boolean variable that determines whether you show a preview of each email in the dashboard list, or a string variable that controls the button text to remove emails from the dashboard list.
By exposing feature configurations as remote variables, you can enable A/B tests beyond just two variations. In the dashboard example, you can experiment not only with turning the dashboard on or off, but also with different versions of the dashboard itself. You can see whether email previews and fewer emails on screen will enable users to go through their email faster
05 Best practice: Avoid common experiment analysis pitfalls
Once you have the above events, you can run an experiment analysis to compare the number of conversion events in each variation and determine which one is statistically stronger.
However, experiment analysis is not always straightforward. It’s best to consult data scientists or trained statisticians to help ensure your experiment analysis is done correctly. Although this book does not dive deep into statistics, you should keep an eye out for these common pitfalls.
Multiple comparisons
Creating too many variations or evaluating too many metrics will increase the likelihood of seeing a false positive just by chance. To avoid that outcome, make sure the variations of your experiment are backed by a meaningful hypothesis or use a statistical platform that provides false discovery rate control.
Small sample size
If you calculate the results of an A/B test when only a small number of users have been exposed to the experiment, the results may be due to random chance rather than the difference between variations. Make sure your sample size is big enough for the statistical confidence you want.
Peeking at results
A classical experiment should be set up and run to completion before any statistical analysis is done to determine which variation is a winner. This is referred to as fixed-horizon testing. Allowing experimenters to peek at the results before the experiment has reached its sample size increases the likelihood of seeing false positives and making the wrong decisions based on the experiment. However, in the modern digital world, employing solutions like sequential testing can allow analysis to be done in real time during the course of the experiment.
Let me know what you think!
Are there other server side best practices that your team follows? Message me in our Slack community or find me on Twitter at @asametrical.
This is part of a series of best practices to help your company successfully implement progressive delivery and experimentation to ship faster with confidence.
If you like this content, check out my free e-book: Ship Confidently with Progressive Delivery and Experimentation which offers more best practices from just getting started to scaling these technologies organization-wide.
And if you are looking for a platform to get started, check out Optimizely’s free offering. Thanks!
About the author