Introducing a Faster, More Powerful Optimizely Results Page
Today we’re excited to announce that Optimizely’s new results page is available to all customers. The results page is Optimizely’s #1 most viewed page, so rebuilding it was no small task. We ran multiple rounds of user research and conducted an extended opt-in beta with more than 6,000 users. In this post, we walk through the features of the brand new experiment results page.

Today we’re excited to announce that Optimizely’s new results page is now available to all customers. Here are some of the big changes:
- Performance Summaries highlight key details about your experiment results such as the number of winning goals and traffic allocation between variations in a simple, at-a-glance view.
- Actionable Goal Panes reduce false positives by emphasizing winning variations only once they’ve achieved statistical significance. Then, you can launch to your visitors with a single click.
- Custom Views (for Platinum Customers) allow you to create and share reusable reports highlighting the specific metrics and audience dimensions that matter to your business.
The results page is Optimizely’s #1 most viewed page, so rebuilding it was no small task. We ran multiple rounds of user research and conducted an extended opt-in beta with more than 6,000 users. Early on, we found that our customers use the results page in a wide variety of ways. Some check in only briefly to assess the general status of experiment goals, while others spend much more time running deeper analyses.
Realizing we needed to meet both of those needs, we rebuilt the page from the ground up. Here are the details behind the key changes:
#1 Performance Summaries
In our research, we discovered that many customers would drop in on the results page to quickly scan whether or not any experiment variations were winning for any of their goals.
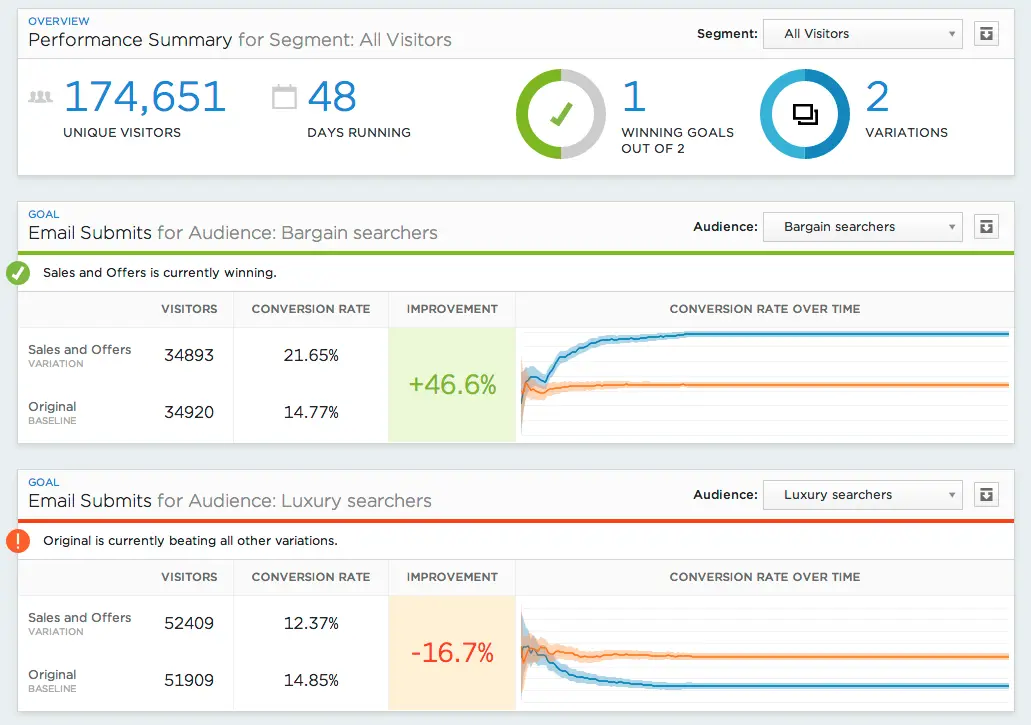
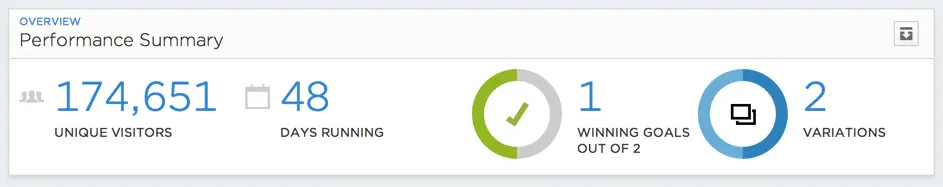
On the new results page, all reports include a Performance Summary to highlight the high-level details you need to know about your experiment in a more digestible way. These details include the amount of time the experiment has been running, the total number of winning goals, and a visualization of the traffic allocation between your variations.
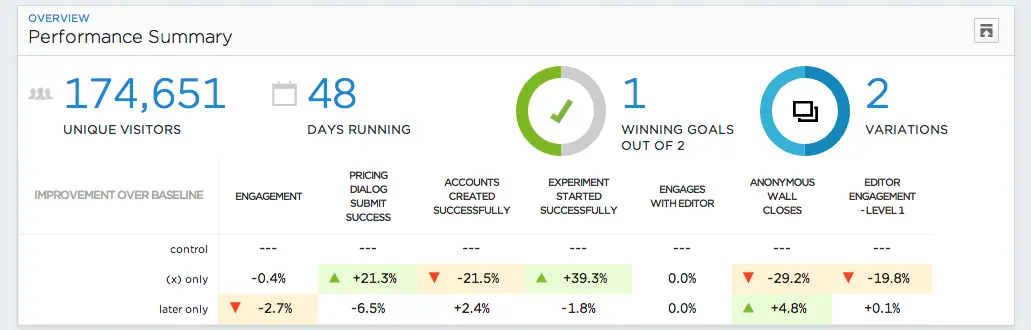
For a more granular view, you can expand the performance summary and even filter it by audience dimensions, such as campaign, browser, or new vs. returning:
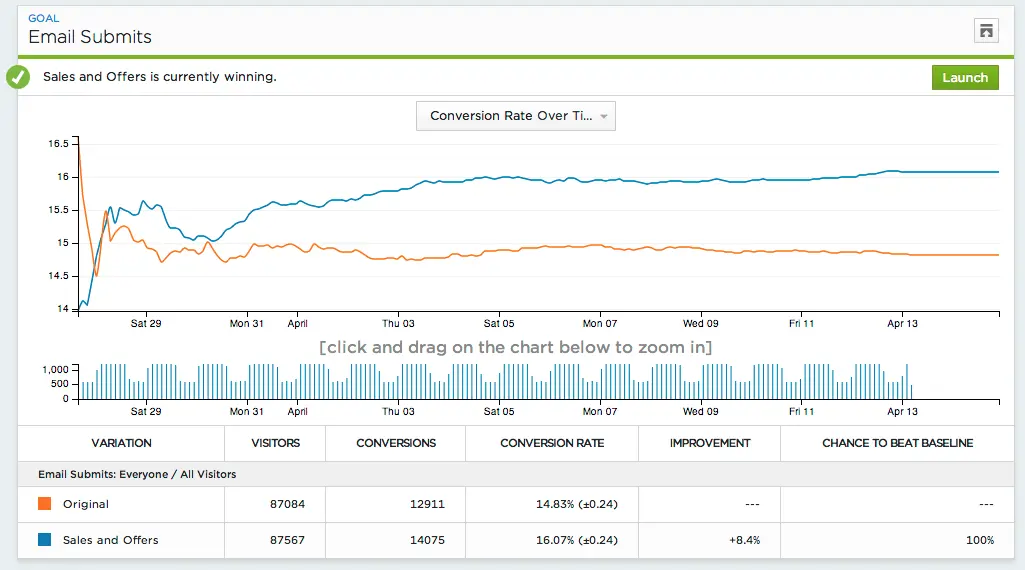
#2 Actionable Goal Modules
It’s easy to jump to conclusions if data shows that one variation might be winning over another, but it can be dangerous to do so without knowing whether that data is statistically significant. That’s why we’re introducing Actionable Goal Modules.
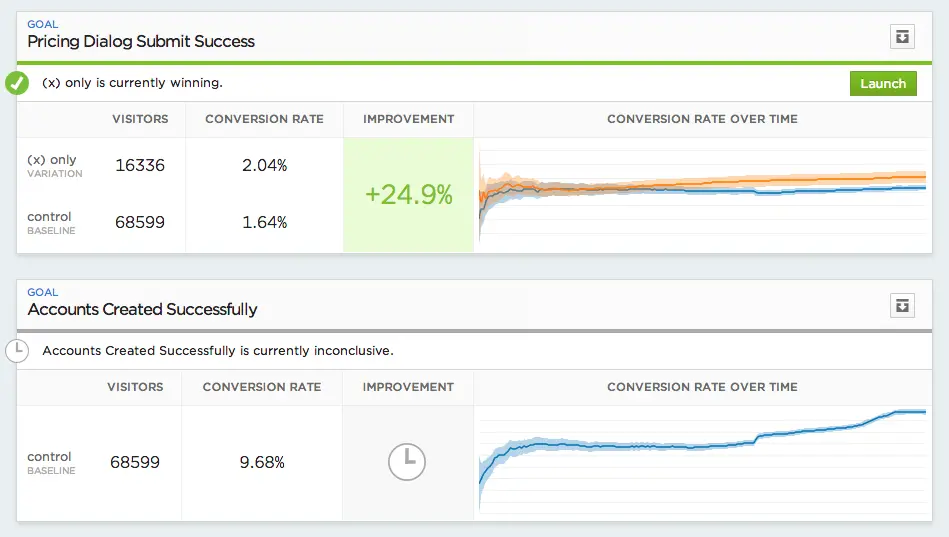
The “Pricing Dialog Submit Success” example above shows a goal with a statistically significant lift of 24.9% for the “(x) only” variation. On the other hand, “Accounts Created Successfully” is still inconclusive.
Once a goal has a statistically significant result for a variation, the goal module will highlight the key details for that variation’s performance relative to control. We’ve chosen to hide data by default for goals that are inconclusive in order to discourage the temptation to read into results that aren’t yet final.
Of course, you can expand the view to see all data, even for inconclusive goals:
It’s important to keep in mind that while a goal might be statistically significant, it may not yet be statistically well powered. We recommend always checking with this sample size calculator to check if your experiment needs to run longer.
#3 Custom Views (for Platinum customers)
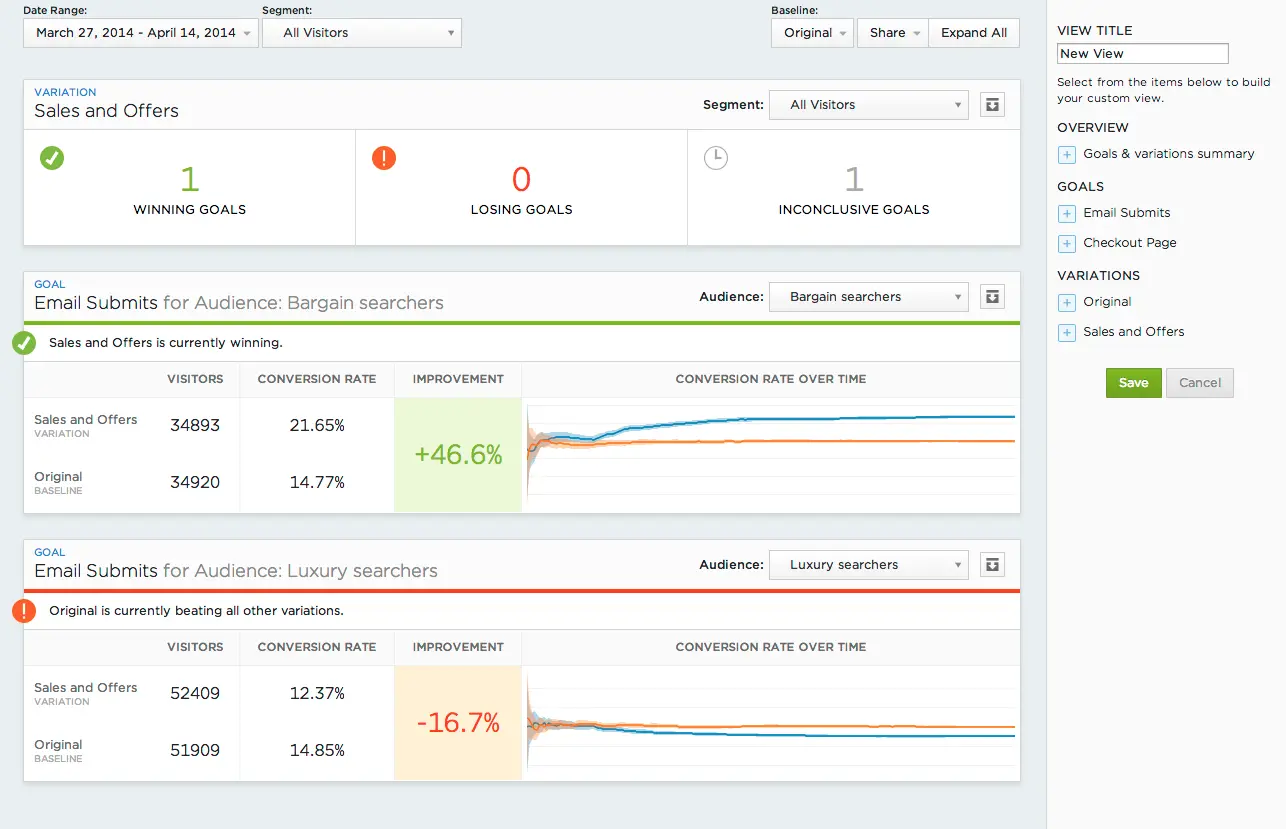
In our research, we were excited to see so many customers doing deep analysis of results to develop custom views to make decisions and share internally with other teams.
The new results page gives customers of all plan levels access to default views so they can better visualize and interpret results.
Platinum customers can also create and share custom views easier than ever before. For example, a custom view can compare performance of individual target audiences, select custom date ranges, and even use a variation as the baseline rather than the control.
You can create these reports customized to your business needs and with the click of a button share them throughout your organization with a shareable link or exporting data to CSV.
Check it out
We’ve worked hard to build a page that highlights the critical insights you need to turn your experiment data into action:

Since we first previewed the new results page in April, we’ve gradually rolled it out to customers and have been making continuous improvements based on your feedback. In fact, more than 75% of our active users were already using the new results page experience before today. Today we’re super excited to share the new results page with everyone.
You can check it out right now! Just check the results of one of your experiments. We hope you enjoy and can’t wait to hear your feedback.