The Results Are In: What We Learned by A/B Testing a Personalized Homepage
Account-Based Marketing (ABM) is taking the world of B2B marketing by storm. The benefits are clear: a strategy that deliberately aligns sales and marketing around a common set of accounts and delivers targeted campaigns to engage those accounts with sales leads to bigger deals and higher close rates.

Shana Rusonis
But in spite of the benefits, there are few practical examples of ABM marketing in action. We recently redesigned and personalized Optimizely’s homepage to reflect our focus on an account-based strategy; and while we were thrilled with what we were able to accomplish in the project, we wanted to quantify the impact.
For those of you out there who are wondering—does ABM drive results? Is a website personalization initiative worth it? We’re going to share our findings, what we’ve learned, and the steps we took to execute the project in a webinar next week: ABM in Practice: How to Personalize your Homepage.
Here’s a preview of what we learned from our adventures with the Optimizely homepage.
To recap what we discussed in our first blog post on the homepage, we undertook the initiative to both redesign and personalize for the following reasons:
- Our high-converting homepage was filling the marketing-sales funnel with leads that weren’t the right fit for Sales to talk to.
- Leads that did start conversations with sales weren’t aware of Optimizely’s products, why we’re different, and what the benefits of becoming a customer were.
- The current homepage was so light on content that we had very few opportunities to personalize content, imagery, or UI components on the page.
Measuring the Impact of Personalization: The Experiment
To measure the impact of the new experience, we tested the new homepage against the old one. In a 50-50 split, half of our homepage visitors would see the old version, while half would see the personalized new one.
When we initially launched the new design (as an A/B test) with personalization campaigns running, we were definitely nervous. We had done our diligence, validating points of friction in Google Analytics and conducting qualitative user research with UserTesting. But we still were uncertain; we were more than doubling the length of the homepage, adding lots of content, where previous tests had told us that removing content would increase the conversion rate.
Testing the new homepage against the personalized one wasn’t a simple apples-to-apples comparison, but we wanted to know that the new homepage design would not slash our conversion metrics. We also wanted to understand how visitors would react to the new design. To get a true signal on these metrics, there’s no better technique than an A/B test.
Here’s what we measured in our test:
- Time on page
- Engagement
- Conversion to our Solutions page, a key product marketing page
- Conversion on the “Test it Out” CTA, which starts the account creation process
- New leads
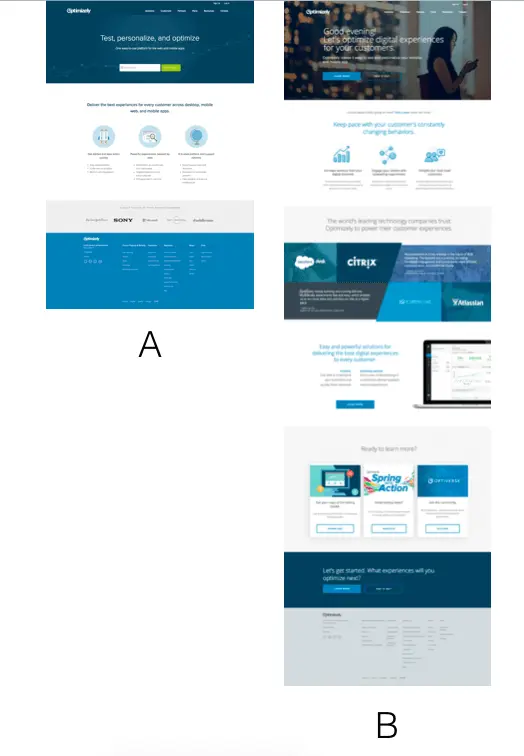
The baseline (A) and redesigned homepage (B) . Click to view larger in a new window.
The Results of our Personalization Experiment
After patiently waiting for the results to come in, it became clear to us that the homepage had not brought our conversion rates crashing down, a relief to everyone on the team. We waited one month for the results to reach >99% statistical significance on each goal we measured, though some had such drastic improvements that we knew much earlier. Here are the results from the personalized homepage:
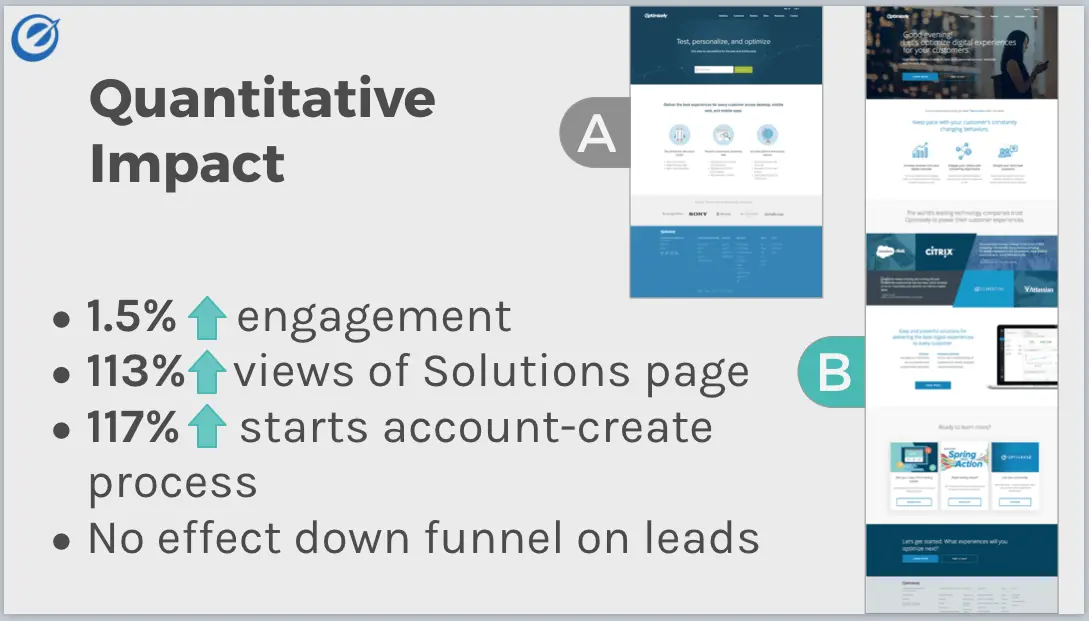
- 1.5% increase in engagement
- 113% increase in conversions to Solutions page
- 117% increase in conversions on “Test it Out” CTA to start account creation process
- Lead conversion rate remained the same
Like most online businesses, the last goal, lead conversion rate, is (and always will be) a goal we are striving to improve. While this new personalized homepage experience is not immediately improving lead quality, we were confident enough in the results — and in the future optimization opportunity — to move 100% of traffic to the new homepage experiences.
What Comes Next?
Short answer: more optimization.
We now have a new baseline to optimize from. As is true in many tests, as long as you have a valid hypothesis, you’ll learn something about your visitors regardless of whether the variation wins, loses, or is inconclusive. Most immediately, we are focusing on that lead conversion rate goal. It’s not very surprising the conversion rate stayed flat, given that the form that visitors see after clicking the “Test it Out” CTA remained the same in both variations.
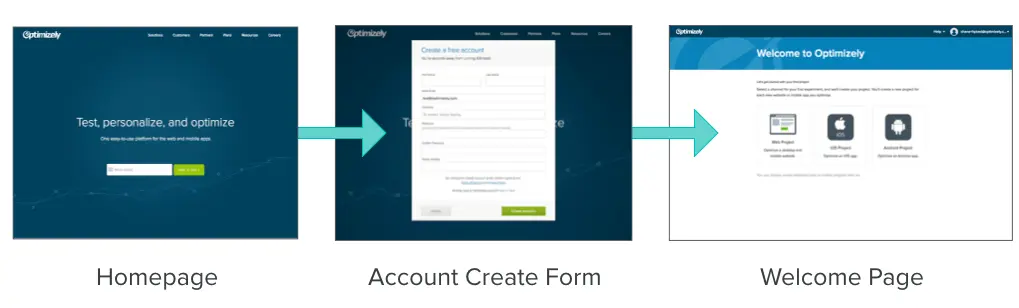
Both the Account Create Form and the Welcome Page remained unchanged in the experiment.
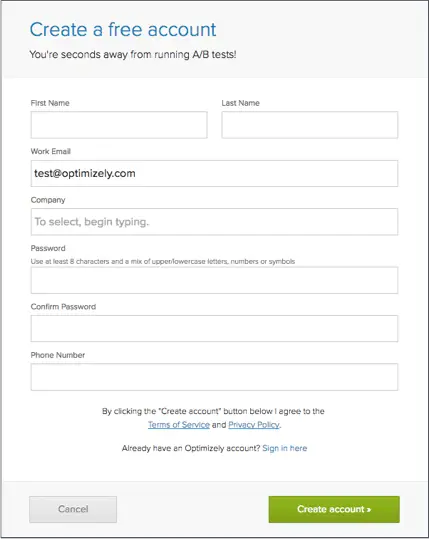
How can we improve this form?
Now, our optimization focus has moved away from the homepage and one step down the funnel to the Account Create Form. We’ve now run several experiments on it to improve the lead conversion rate while still optimizing for high-quality, educated visitors to engage with our product. More to come on those experiments and other personalization experiences we’re delivering on Optimizely domains soon!
About the author