Obamas experiment på 60 miljoner dollar

Test
Den 21 oktober 2010 besökte President Obama Palo Alto för att samla in pengar på det gamla hederliga sättet: en insamlingsmiddag på 30 400 USD per tallrik. Denna beprövade insamlingsteknik är ett bra sätt att samla in pengar om du kan få USA:s President att dyka upp på middagen.
Men hur kan du samla in pengar om ingen har hört talas om dig och allt du har är en webbplats?
År 2007, när Obama försökte bli nominerad och låg tvåsiffrigt efter i opinionsmätningarna, var det i stort sett allt vi hade.
Experimentet
Som Director Analytics för Obamas kampanj 2008 var det mitt jobb att använda data för att hjälpa kampanjen att fatta bättre beslut. Vi började med ett enkelt experiment i december 2007.
Experimentet lärde oss att varje besökare på vår webbplats var en möjlighet och att om vi utnyttjade den möjligheten genom webbplatsoptimering och A/B-testning kunde det hjälpa oss att samla in tiotals miljoner dollar.
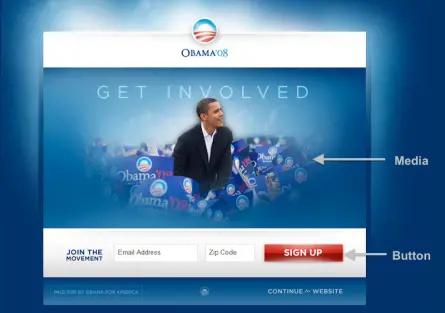
I experimentet testades två delar av vår startsida: avsnittet "Media" högst upp och "knappen" för call to action

Vi testade fyra knappar och sex olika medier (tre bilder och tre videor). Vi använde Google Website Optimizer (nu Google Optimize) och körde detta som en fullfaktoriell multivariat testning, vilket bara är ett fint sätt att säga att vi testade alla kombinationer av knappar och media mot varandra samtidigt.
Eftersom vi hade fyra knappar och sex olika medier innebar det att vi hade 24 (4 x 6) totala kombinationer att testa. Varje besökare på splash-sidan fick slumpmässigt se en av dessa kombinationer och vi spårade om de registrerade sig eller inte.
Innan du scrollar ner och ser resultaten, vilken knapp och media tror du hade den högsta registreringsgraden?
Variationer av knappar


Resultat
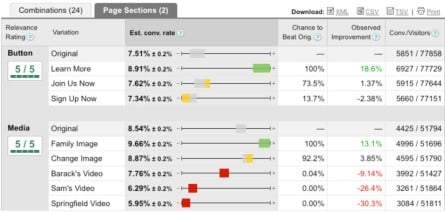
Det mått vi använde för att mäta framgång var registreringsfrekvensen: antalet personer som registrerade sig dividerat med antalet personer som såg den specifika variationen. Eftersom det fanns totalt 310 382 besökare på splash-sidan under experimentet innebar det att varje variation sågs av ungefär 13 000 personer.
Här är de olika registreringsgraderna som vi observerade för varje avsnitt:

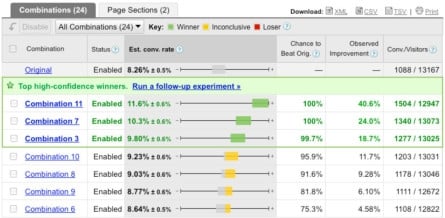
Här är anmälningsfrekvenserna för kombinationerna av de olika avsnitten:

Vinnaren

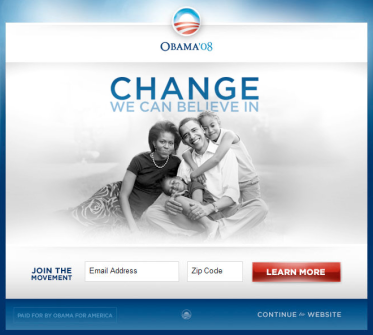
Den bäst presterande kombinationen av knapp och media var "Kombination 11", som bestod av knappen "Läs mer" och bilden "Familj":
Innan vi genomförde experimentet föredrog kampanjpersonalen starkt "Sams video" (den sista i bildspelet som visas ovan). Om vi inte hade kört det här experimentet skulle vi med stor sannolikhet ha använt den videon på startsidan. Det skulle ha varit ett stort misstag eftersom det visade sig att alla videor gjorde sämre ifrån sig än alla bilder.
Den vinnande varianten hade en registreringsgrad på 11,6 %. Den ursprungliga sidan hade en registreringsgrad på 8,26 %. Det är en förbättring med 40,6 % i registreringsgrad. Vad innebär en förbättring på 40,6 %?
Tja, om du antar att denna förbättring var ungefär densamma under resten av kampanjen, kan vi titta på de totala siffrorna i slutet av kampanjen och avgöra vilken skillnad detta enda experiment hade. Ungefär 10 miljoner människor registrerade sig på splash-sidan under kampanjen. Om vi inte hade kört det här experimentet och bara hållit fast vid den ursprungliga sidan skulle det antalet vara närmare 7 120 000 registreringar. Det är en skillnad på 2 880 000 e-postadresser.
Att skicka e-post till personer som registrerade sig på vår startsida och be dem att anmäla sig som volontärer omvandlade vanligtvis 10 % av dem till volontärer. Det innebär att ytterligare 2 880 000 e-postadresser översattes till 288 000 fler volontärer.
Varje e-postadress som skickades in via vår startsida donerade i genomsnitt 21 USD under kampanjens gång. De ytterligare 2 880 000 e-postadresserna i vår e-postlista innebar ytterligare 60 miljoner USD i donationer.
Lärdomar som dragits
- Varje besökare på din webbplats är en möjlighet. Utnyttja den möjligheten genom webbplatsoptimering och A/B-testning.
- Ifrågasätt antaganden. Alla i kampanjen älskade videorna. I slutändan gjorde alla videor sämre ifrån sig än alla bilder. Vi skulle aldrig ha vetat om vi inte hade ifrågasatt våra antaganden.
- Experimentera tidigt och ofta. Vi genomförde detta experiment i december 2007 och skördade frukterna av det under resten av kampanjen. Eftersom det första experimentet visade sig vara så effektivt fortsatte vi att köra dussintals experiment på hela webbplatsen under hela kampanjen.
Varför Optimizely?
Vi skapade Optimizely för att vi ville göra experiment som det här enklare att göra. Faktum är att Optimizely är den produkt jag önskar att vi hade haft med i kampanjen.
Vi kunde bara köra en liten del av de experiment vi ville köra under kampanjen på grund av den tid och det krångel som krävdes för att köra experiment med produkter som fanns vid den tiden.
Om du letar efter ett enklare sätt att testa din webbplats, ge Optimizely ett försök och låt oss veta vad du tycker.
- Last modified:2025-04-26 00:15:01
