Top 10 takeaways from the experimentation playbook
Supported by lessons learned from running 127,000 experiments.


Most experiments don't win. That's the point.
Only 12% of experiments produce a statistically significant improvement on the primary metric. Teams are roughly as likely to see a negative result as a positive one. Most changes have no measurable impact at all. That's not a failure of experimentation. It's an honest reckoning with how hard it is to change user behavior in complex digital environments.
When you treat experimentation as a system rather than a series of one-off tests, that uncertainty becomes compounding learning.
If you are looking to build a high-performance experimentation program, here are the top 10 takeaways from the 2026 experimentation playbook👇
1. There is nothing inherently better about a winning test than a losing test
Only 12% of experiments produce a statistically significant improvement on the primary metric. Teams are roughly as likely to see a negative result as a positive one.
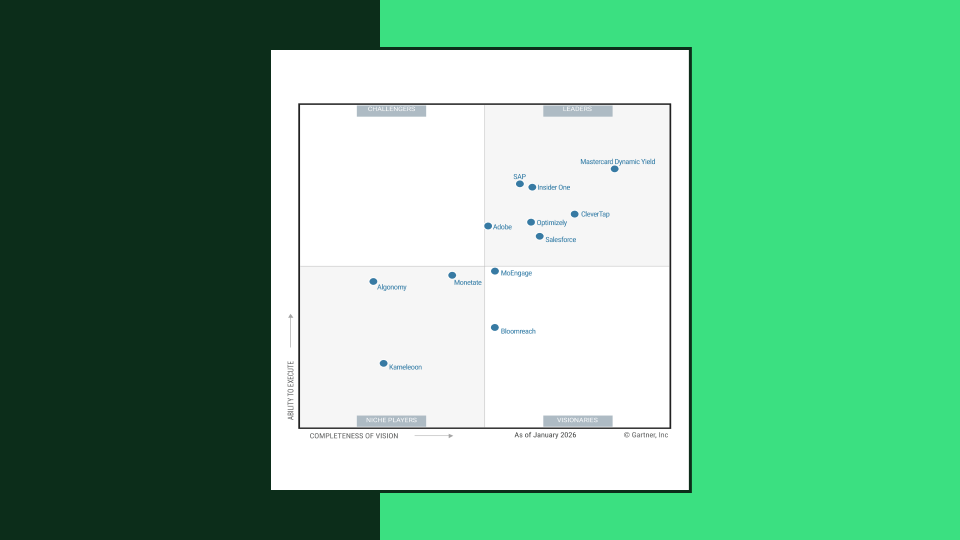
Optimizely customers see each revenue-focused experiment deliver an average incremental 0.4% lift in digital revenue when results are applied, refined, and built upon. A 12% win rate combined with a 0.4% lift per winner, applied consistently, turns into compounding improvement over time.
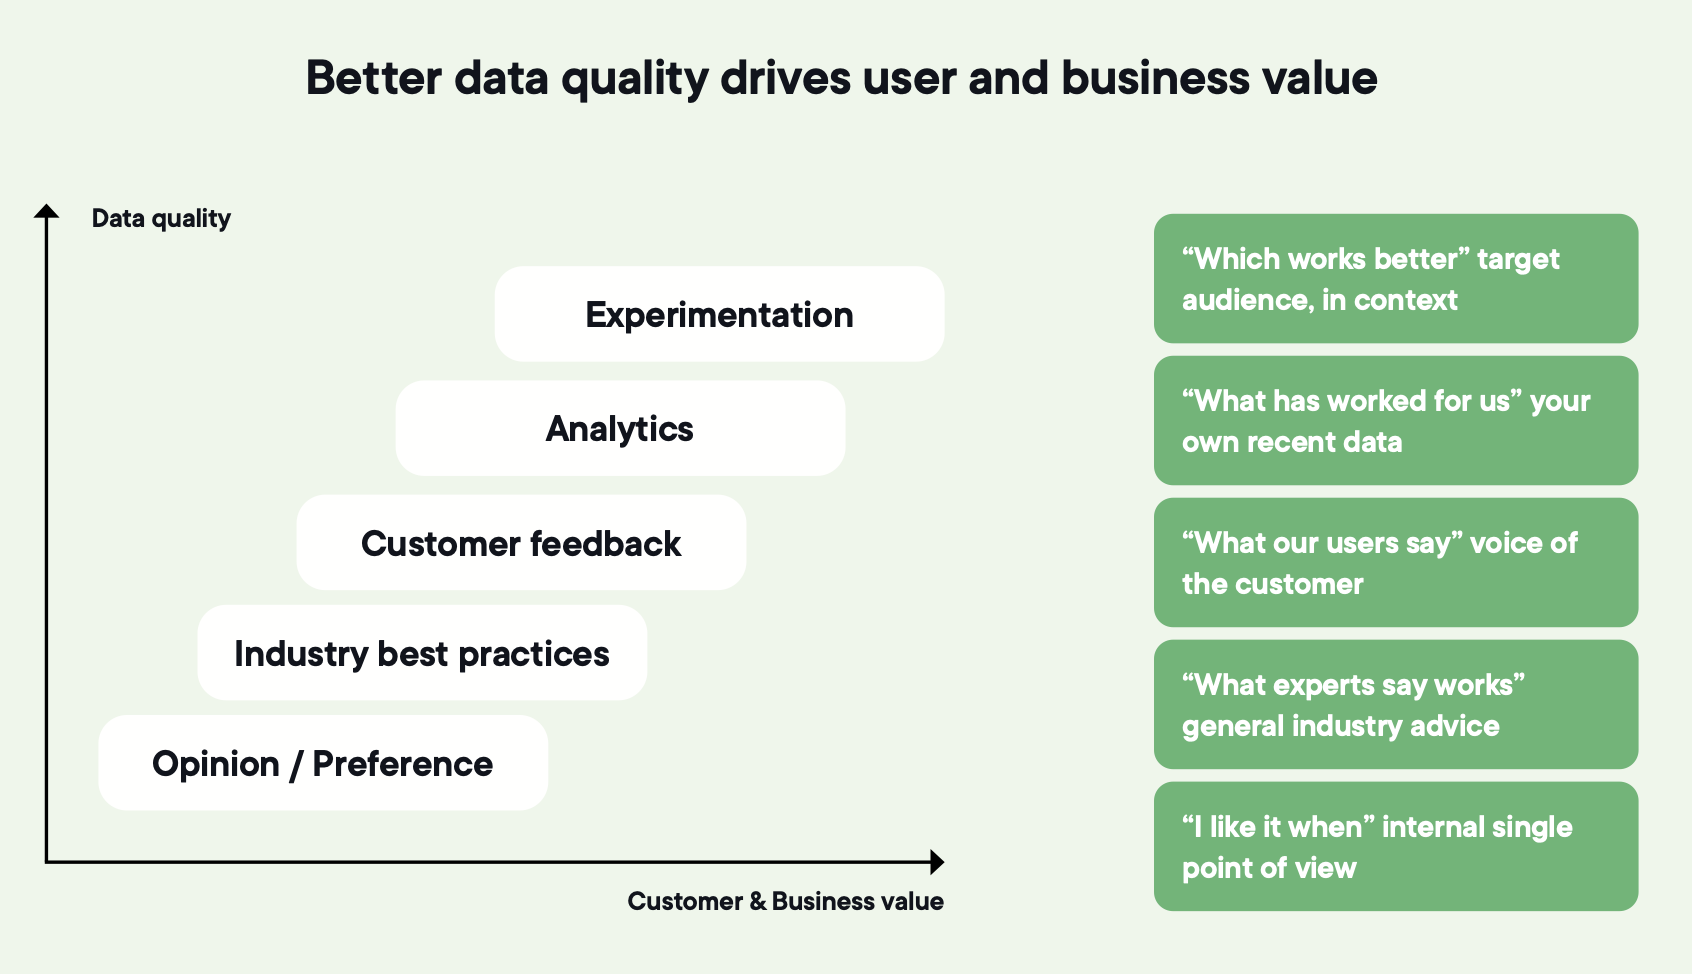 Image source: Optimizely
If nine out of ten of your tests are winning, something is off. Either the control is weak, the metric is loose, or tests are being called the moment they turn green. Most ideas don't survive contact with users, and that's how it should be.
Frame the value of experimentation in terms of uplift over time, not wins per quarter.
The Experimentation Playbook
Optimizely
2. Tie every experiment to a business goal or expect it to be ignored
Early-stage programs tend to share the same three problems.
Experiments that move page-level metrics leadership never looks at, results that get discussed but never acted on, and a value story that's impossible to communicate, so success stays siloed instead of building momentum.
The fix is making the connection explicit. Each experiment anchored to a goal the business already cares about. Results measured consistently. Experimentation treated as a decision-making system rather than a side project.
![]() Image source: Optimizely
Image source: Optimizely
You can run statistically perfect experiments and still struggle to explain why anyone should care. That's how programs lose funding even when the work is good.
3. Define what good looks like for the program, not just the test
Most teams measure individual experiments and assume the program is healthy if enough tests are running. It isn't.
A working program needs its own success criteria, separate from any single result:
- Are you testing often enough?
- Are you testing well?
- Are the changes meaningful enough to move the business?
- Are you sharing what you learn in a way people can act on?
These four questions sit above the question of whether any one test won, and the programs that can answer them keep their seat at the table when budgets tighten.
4. If you cannot trace a test to the North Star, alignment is missing
Strong programs use a three-layer hierarchy.
-
A single North Star at the top: the outcome the business is ultimately driving toward, like revenue, retention, or customer lifetime value. It's the direction, not the metric you test against. If every experiment is supposed to move this metric directly, the North Star is being misused.
-
Three to five strategic metrics in the middle: the levers leadership already uses to gauge performance. Conversion rate, acquisition efficiency, average order value, feature adoption.
-
Optimization goals at the bottom: the user behaviors a single experiment can directly influence. Add-to-cart rate, drop-off at delivery, registration completion.
Every experiment should ladder cleanly from an optimization goal to a strategic metric to the North Star.
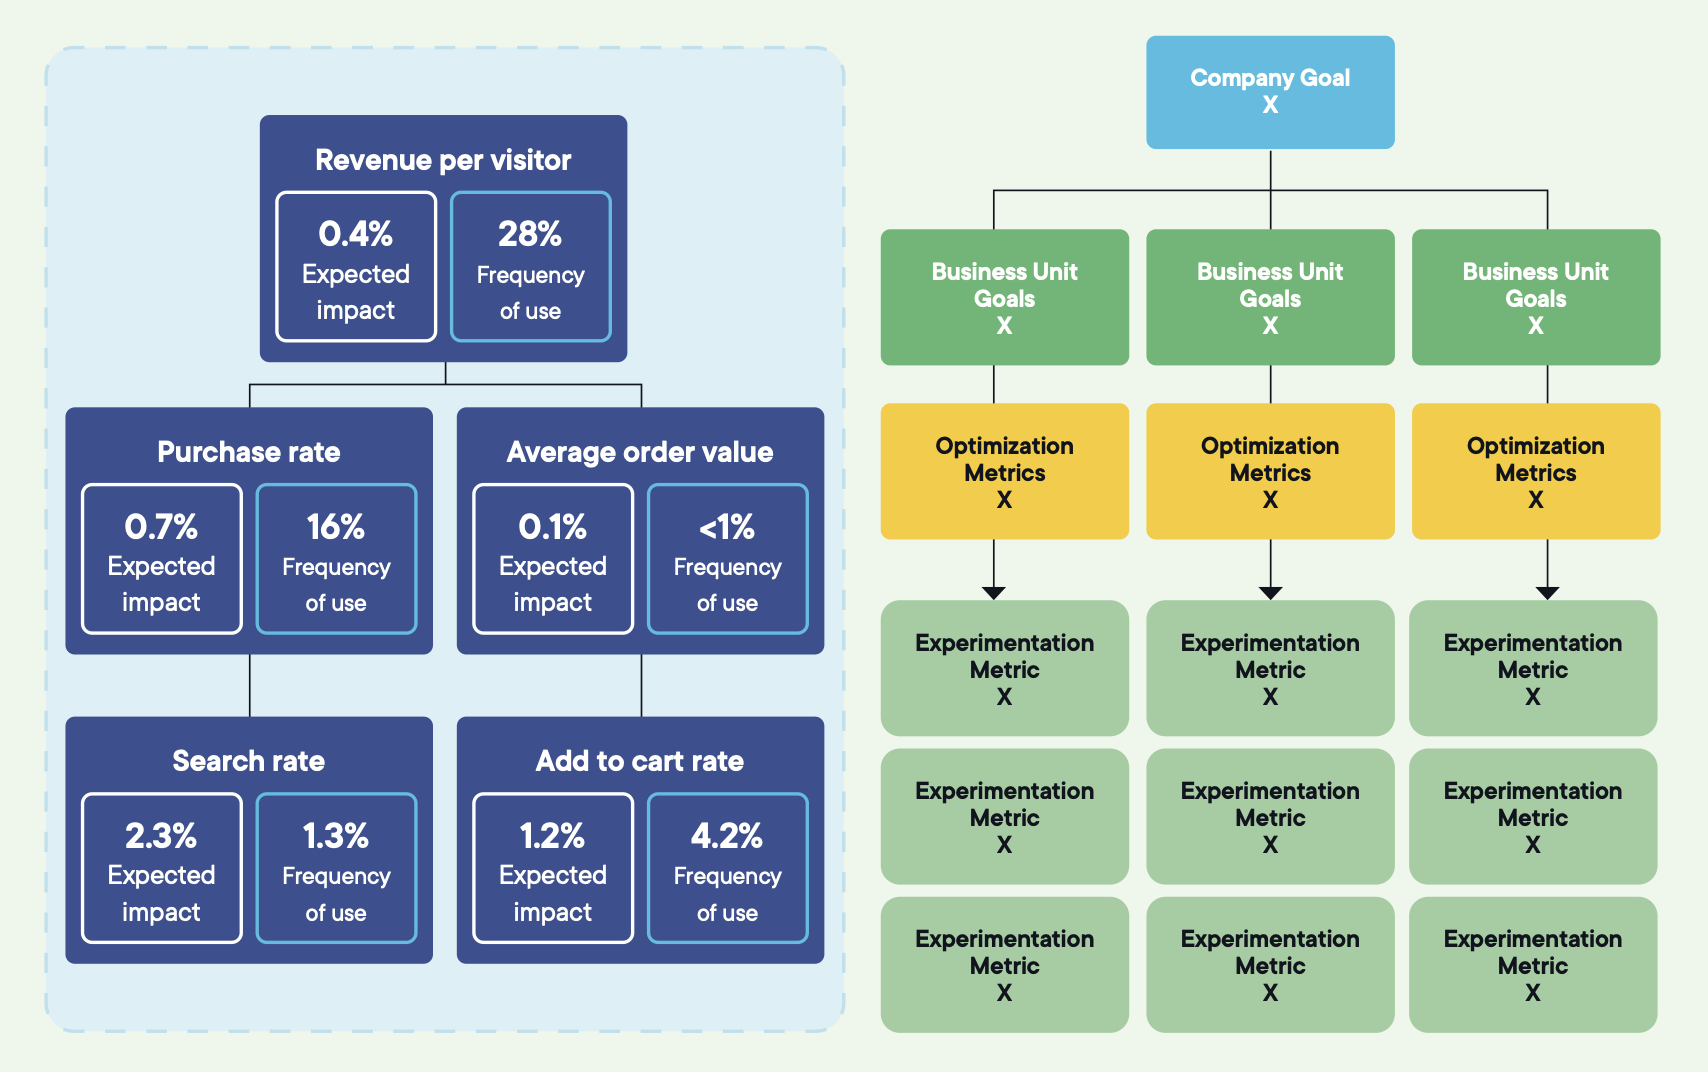 Image source: Optimizely
Pick any active experiment and ask whoever owns it which strategic metric it supports and how. If the answer is fuzzy, the goal tree isn't doing its job.
5. Velocity, quality, and scope — measure all three
Velocity matters early on, when the constraint is cadence and the team is still learning to ship tests reliably.
The median company runs 34 experiments a year. The top 3% run over 500.
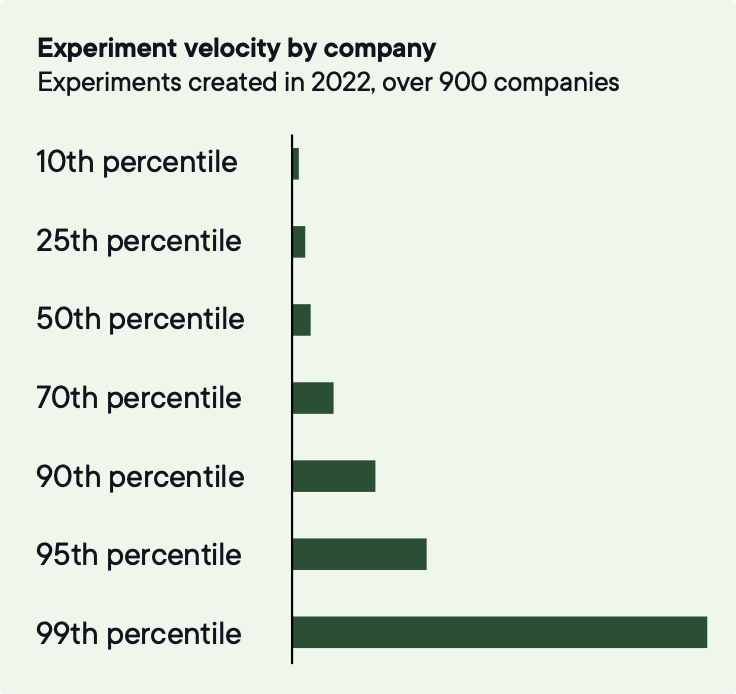 Image source: Optimizely
To be in the top 10% of experiment velocity, companies need to run around 200 tests annually.
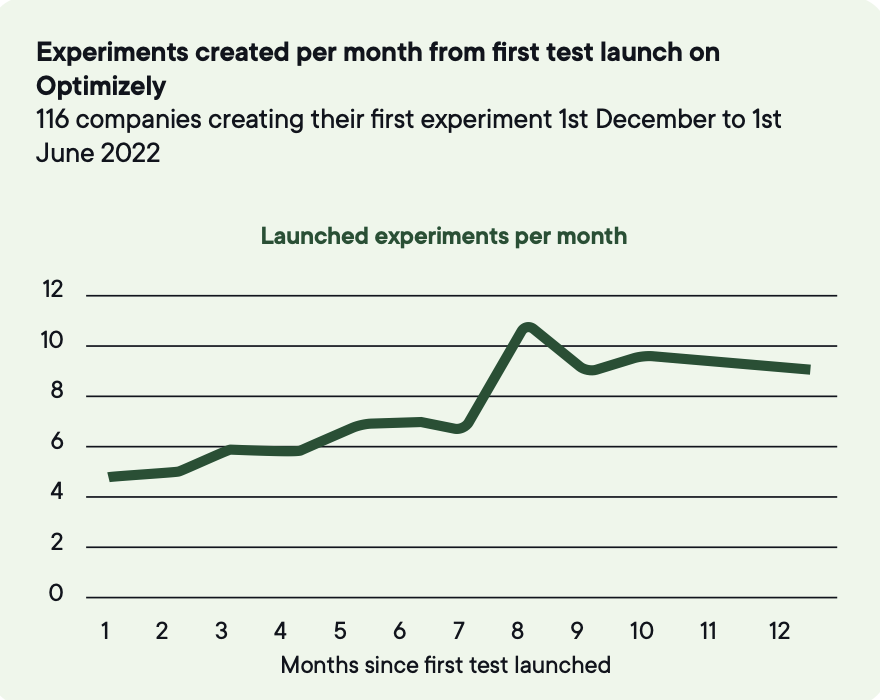 Image source: Optimizely
Volume is how you turn unpredictable individual outcomes into reliable program-level improvement, because most experiments don't produce a statistically significant win and progress comes from testing often enough that wins can emerge.
But velocity alone produces the same business impact at double the cost once a program scales. The teams that keep growing measure two more things alongside it.
Quality reflects whether you're moving beyond single A/B tests toward richer approaches. Experiments with four variations deliver 3.5x the expected impact of a typical A/B test. Programs that never leave A/B testing leave that lift on the table.
Scope reflects whether you're testing changes meaningful enough to actually influence user behavior. Low-hanging fruit dries up. Sustained impact requires testing across more pages, more journeys, and more types of change. Experiments combining three or more change types deliver the strongest gains.
If your volume is climbing but most tests still compare A versus B on the same handful of pages, the program is getting busier without getting better.
The Experimentation Playbook
Optimizely
6. A program is a lifecycle, not a queue
Most programs run as a queue. Ideas get submitted, tests get built, results get filed, and new ideas get submitted. The work keeps moving and nothing between the stages connects.
A lifecycle has six stages, and each one feeds the next.
- Hypothesis creation
- Prioritization
- Planning and design
- Execution and monitoring
- Analysis and interpretation
- Deployment and iteration
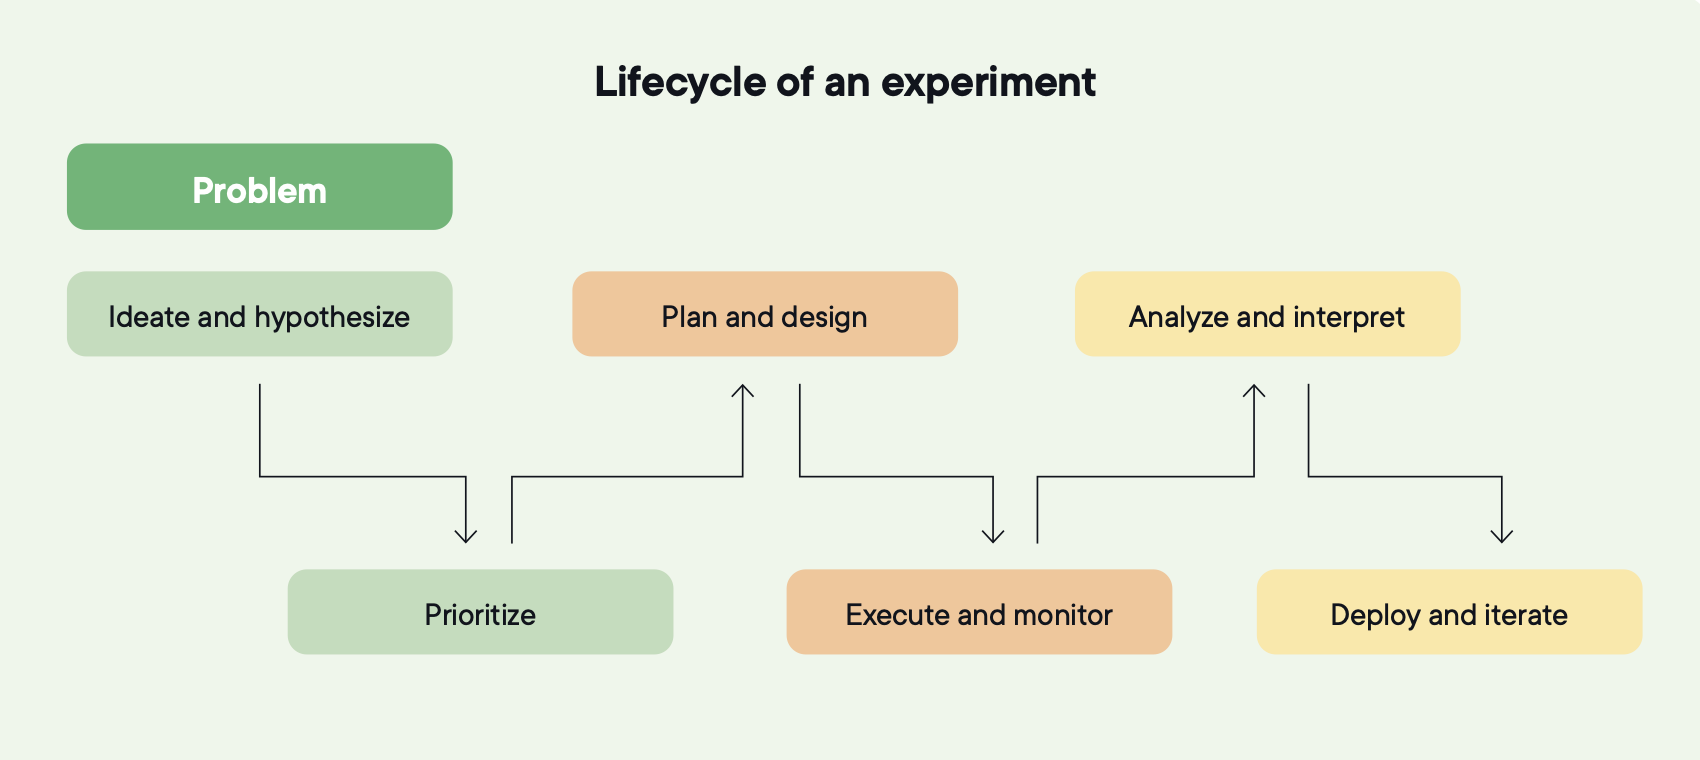 Image source: Optimizely
Analysis from last quarter shapes the hypotheses generated this quarter. Prioritization shifts when a checkout test teaches the team something about delivery fees. Deployment becomes the input to the next experiment, not the end of this one.
That's how a team stops running experiments and starts building an experimentation capability. The mechanics of any single test matter less than whether the loop closes.
7. Start with the problem, not the idea
Most experiments fail in the hypothesis stage, long before execution or analysis.
"We should try a longer headline" is a solution looking for a problem.
"Users don't understand how delivery fees work until the final checkout step, and 25% of surveyed users say that's why they left" is a problem specific enough to build a test around.
The Problem-Solution-Result (PSR) framework keeps this discipline: a validated user or business problem, a proposed change to address it, and a measurable outcome that would indicate success.
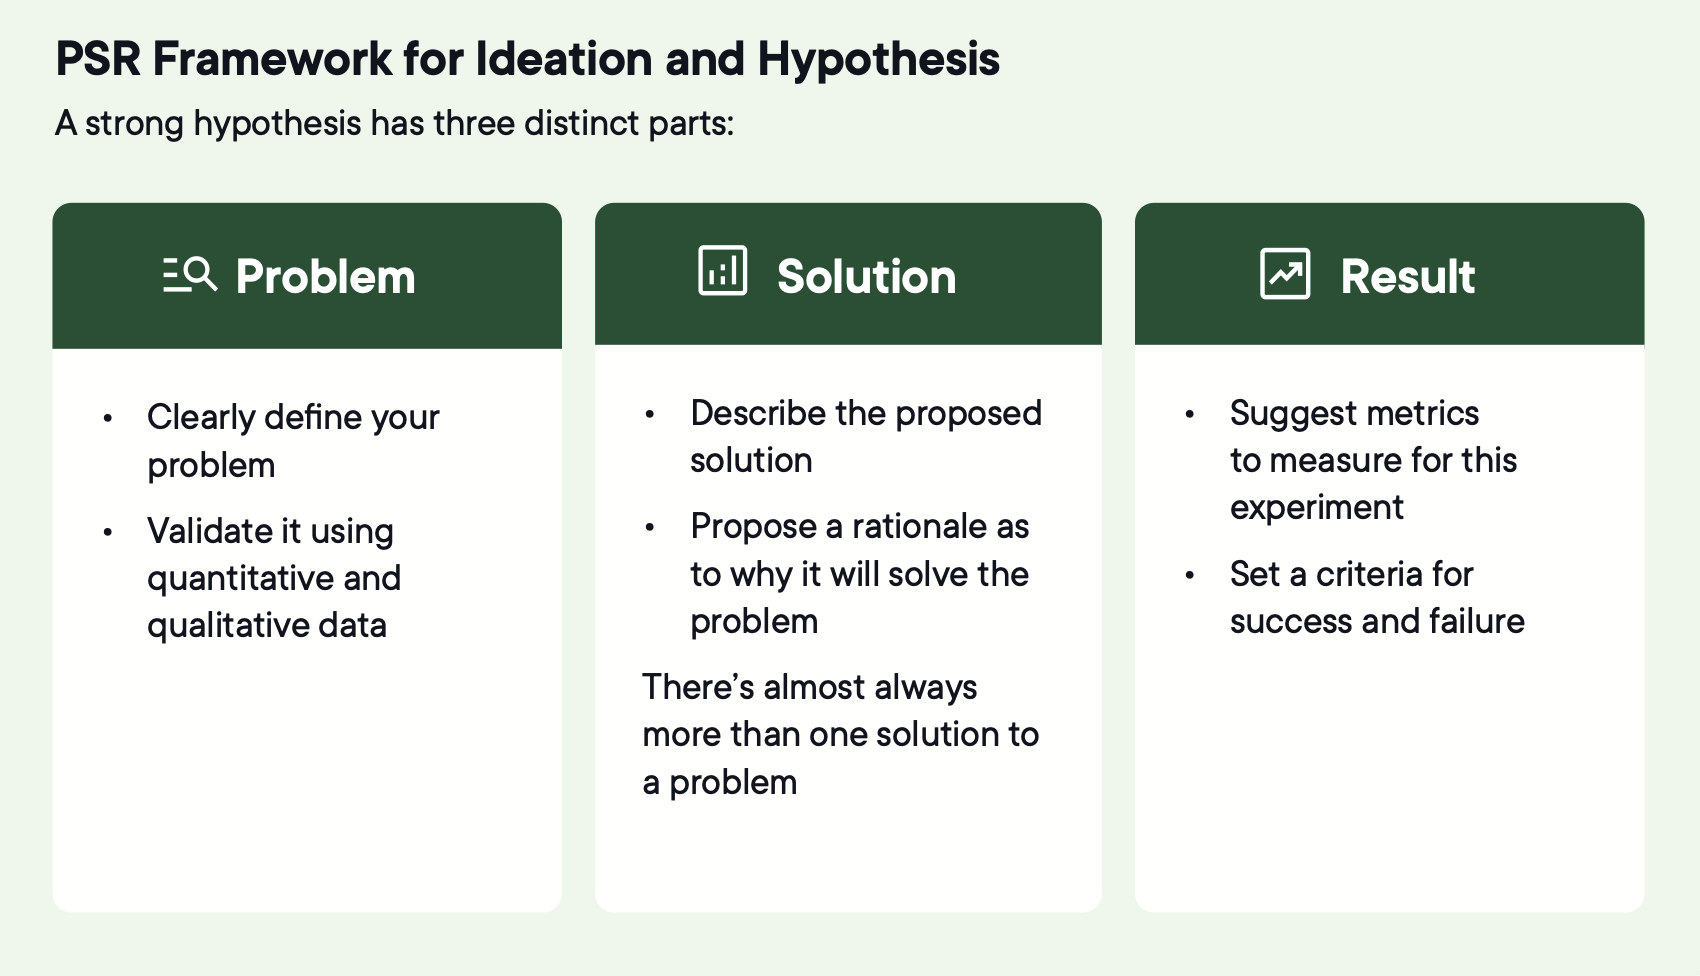 Image source: Optimizely
A strong problem statement is user-centered, evidence-backed, specific but not prescriptive about the fix, and relevant now. Skip this and you're testing opinions.
8. Test three to five solutions per problem, not one
A team running A versus control places one bet per problem. A team running three to five variations tests whether any of several approaches solve the problem.
That improves more than your odds. It changes how the team works. Risk-taking goes up because safer options are covered. Ownership broadens because more contributors see their ideas tested. The team explores multiple directions at once rather than committing to one path and waiting weeks to learn it was wrong.
Testing 4+ variations changes team behavior:
- Risk-taking increases because safe options are covered.
- Ownership expands because more contributors see their ideas tested.
- Agility improves because teams explore multiple directions simultaneously.
9. Your backlog is how you prioritize, or it's how you apologize
Every program has more ideas than capacity. Without a shared prioritization model, the loudest stakeholder wins, and the backlog starts to look like the org chart.
RICE (reach, impact, confidence, effort) is the common choice because it forces four trade-offs into one comparable score.
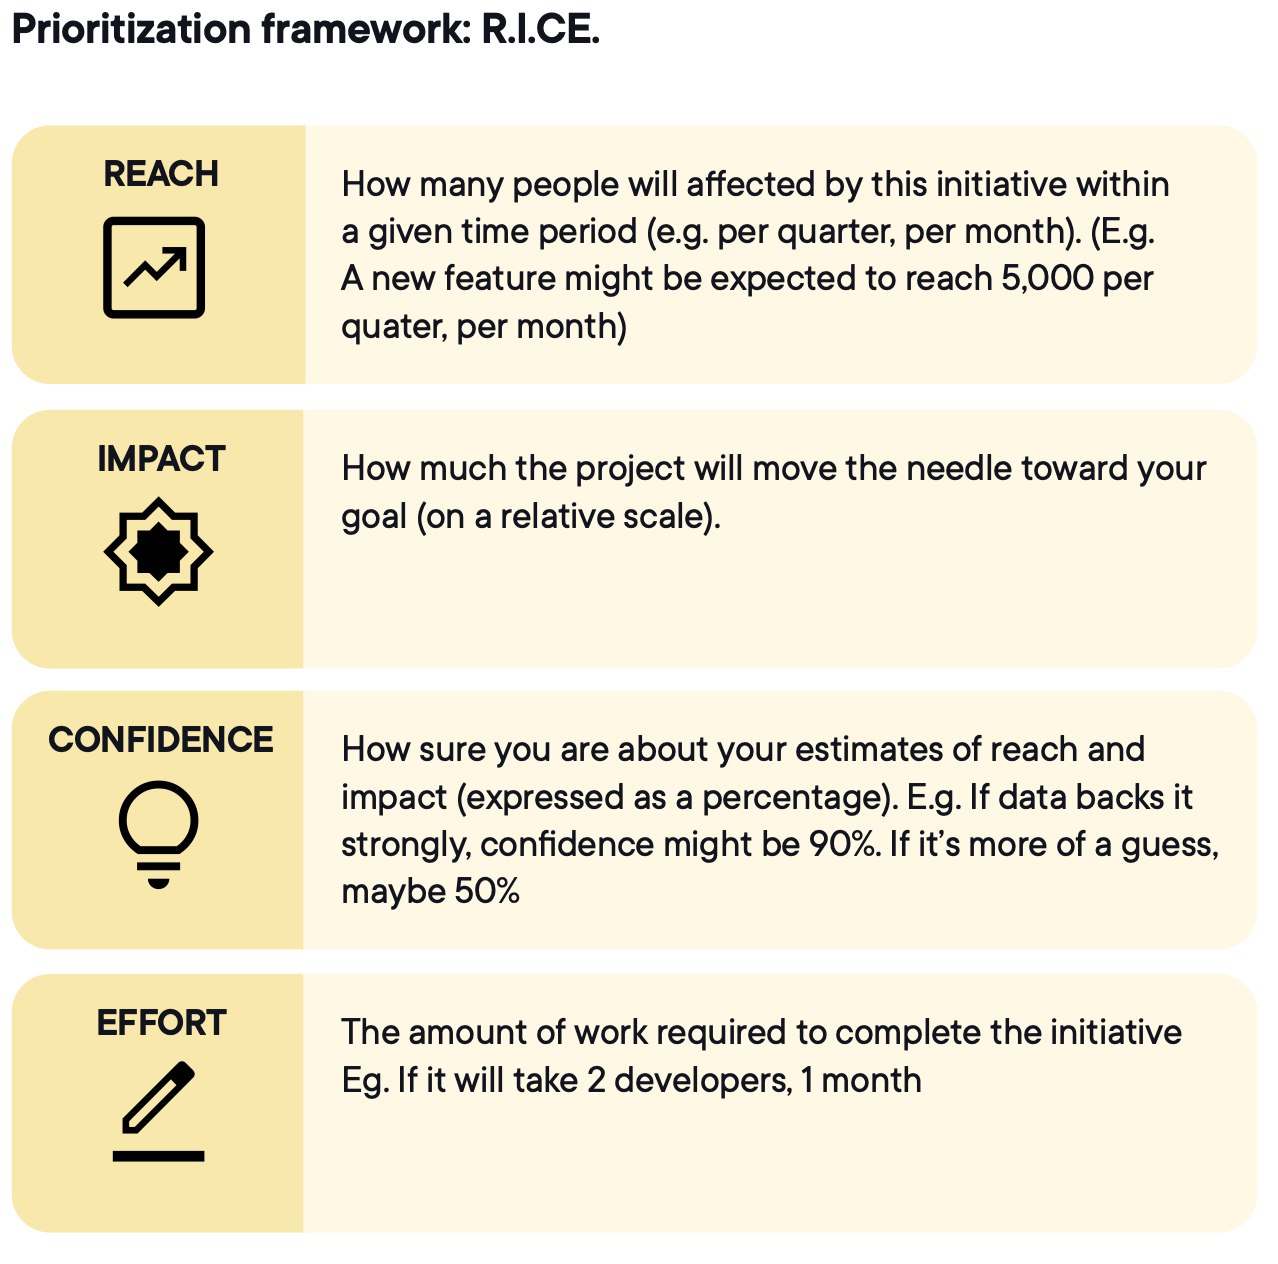 Image source: Optimizely
A checkout flow test might score high on reach and impact but require weeks of engineering. A pricing-page copy test might score lower on impact but higher on confidence and far lower on effort. RICE makes the trade-off explicit, so prioritization is driven by shared criteria rather than urgency or hierarchy.
The score is meant to start the conversation, not end it. When the same team scores ideas the same way over time, the backlog becomes a living view of the experimentation strategy. What's being tested now, what's coming next, and which uncertainties the organization has chosen to resolve in what order.
Five things to avoid:
- Inflating impact to push ideas through
- Treating confidence as intuition rather than evidence
- Ignoring reach constraints
- Underestimating effort by leaving out QA and analytics work
- Treating the score as the final answer instead of a ranked starting point
10. Every experiment should make the next one smarter
A program compounds when results actively shape future decisions. Proven mechanisms get reused, disproven assumptions stop getting retested, and confidence is earned through evidence rather than reset to intuition each cycle. Past experiments get referenced during ideation and planning, not only in the quarterly readout.
When that loop is working, experimentation becomes a shared, evidence-based understanding of how users behave that informs every decision, not just the ones being tested. When it isn't working, experimentation produces records instead of progress.
Two things have to be true:
1. Inconclusive results have to be treated as learning
A healthy program has a 35–40% conclusive rate, which means roughly 60% of tests don't produce a clear win or loss. The useful question after an inconclusive test is what went wrong with the detection rather than the idea.
- Was the sample size too small?
- Was the metric too far downstream from the change?
- Was the contrast between variations too thin?
2. Learning has to be findable
Most teams can't sustain this manually as test volume grows. Insights get buried, and different teams retest the same hypothesis without realizing it. Inside Optimizely, 58.74% of all Opal agent usage is now experimentation, and 19.54% of follow-up tests are driven by agent recommendations grounded in prior results. Agents reference the team's experiments, results, and flags, and surface what's been tried before a new hypothesis gets written.
If you can't clearly state what the last experiment taught you and what new question the next one is meant to answer, you're not iterating. You're just changing things.
Where to go from here
The patterns above echo what most experimentation teams know from experience.
Programs compound when learning is applied, velocity matters less than what gets done with it, and the difference between a team that runs tests and a team that builds a capability comes down to a handful of disciplined commitments.
Here are the most actionable takeaways from The Experimentation Playbook:
-
Build the goal tree before the backlog: Every experiment should ladder from an optimization goal to a strategic metric to a single North Star. Without that line of sight, results are hard to act on regardless of which way they land.
-
Measure the program, not just the test: Velocity, quality, and scope each tell a different story about how the program is doing. Track all three, and you'll know whether you're getting bigger or actually getting better.
-
Treat the lifecycle as the unit of work: Hypothesis, prioritization, planning, execution, analysis, deployment. Each stage feeds the next. The mechanics of any single test matter less than whether the loop closes.
Many Optimizely customers are already putting these into practice. We'll keep sharing what we learn from how the best programs operate, and from how AI is changing the work itself.
Full playbook
The takeaways above are the short version. The full report covers the six-stage lifecycle in detail, the prioritization and metric frameworks in practice, the analysis discipline that turns results into decisions, and the operating cadence behind all of it.