Optimizely warehouse native experimentation vs. Amplitude, Statsig, and Eppo

Experimentation platforms determine how your team tests, learns, and optimizes for years to come. We built this honest comparison because buyers deserve transparent information about tradeoffs, not marketing pitches.
The goal isn't to convince you to choose Optimizely warehouse native experimentation; it's to help you choose what actually fits your needs.
Warehouse-native experimentation platforms work directly with your existing data infrastructure—Snowflake, BigQuery, Databricks, or Redshift—eliminating data silos and connecting experiment results to business outcomes without reverse ETL or custom pipelines.
Here's a value-based comparison of warehouse-native experimentation platforms:
-
Optimizely vs. Amplitude
-
Optimizely vs. Statsig
-
Optimizely vs. Eppo
Let's get started.
1. Optimizely vs. Amplitude
Amplitude built a solid product analytics platform with strong user journey visualization and behavioral segmentation. They've been at this for years and have a large community of users who like their interface. While they do offer experimentation capabilities through SDKs, their strength remains in analytics.
Event-based pricing adds up fast
Amplitude uses event-based pricing, which can become expensive quickly.
A typical e-commerce site tracking onboarding steps and cart abandonment can hit 50,000 monthly events with just 2,000 users.
As you scale, you'll pay for events you set up but no longer use.
More importantly, Amplitude locks your data into its system. While you can track unlimited events, connecting that data to information outside Amplitude, like customer lifetime value from your CRM or revenue data from your billing system, becomes challenging and requires additional tools.
Want to connect experiment results to customer lifetime value data sitting in your warehouse? You'll need reverse ETL and a lot of engineering time to make it work.
The gap
While Amplitude excels at analytics, your data lives in Amplitude's system, separate from the rest of your business data in your warehouse.
This means you can't easily connect experiment results to customer lifetime value, revenue data, or other critical business metrics without ETL and significant engineering effort. As your data infrastructure matures, this architectural mismatch becomes increasingly costly.
Amplitude works if:
- You need strong product analytics with established user journey tools
- Session replays and heatmaps are critical to your workflow
- Event-based tracking meets your need and you don't need to connect analytics data to your broader data warehouse
Consider Optimizely instead if:
- You've invested in a data warehouse (Snowflake, BigQuery, Databricks, Redshift) and want experimentation that works directly with your existing infrastructure
- You need to connect experiment results to business data (revenue metrics, CRM data, customer lifecycle information) without ETL
- You want rich analytics built specifically for experimentation insights, not just general product analytics
Six reasons to choose Optimizely Analytics over Amplitude:
| Optimizely Analytics | Amplitude | |
| AI | Live capabilities for variation generation and data exploration | AI features are still in beta without enough functionality |
| Data architecture | Warehouse-native: Works with your existing Snowflake, BigQuery, Databricks, or Redshift infrastructure | Event-based tracking with warehouse integration (Snowflake only) |
| Pricing model | Predictable warehouse-based pricing | Event-based pricing that escalates with growth (50k events with just 2k users) |
| Cross functional collaboration | Single tool for product, marketing, customer success, and data teams—everyone works from the same source of truth | Primarily built for product teams; marketing and customer teams often need separate tools |
| Platform scope | Analytics, experimentation, personalization, AI, and content management in one platform | Strong analytics with nascent experimentation, but lacks personalization capabilities |
| Data ownership | Your data stays in your warehouse - single source of truth | Data locked into Amplitude's system requires reverse ETL for complex cross-analysis |
Complete feature comparison: Optimizely Analytics vs. Amplitude
Most importantly, Optimizely Analytics is your single source of truth. The biggest challenge for growing teams is managing multiple analytics tools, each maintaining its own copy of your data. When Google Analytics reports 53 site visits, Amplitude shows 55, and your internal dashboard says 58, you're left wondering which number to trust.
These discrepancies happen because each tool collects and stores data differently, creating multiple versions of reality. With Optimizely's warehouse-native approach, all teams analyze the same data from your warehouse. One source, one truth, zero confusion about which metrics are accurate.
2. Optimizely vs. Statsig
Statsig is built for engineering teams who want focused experimentation tools. They keep things simple and technical, which resonates with developers.
The acquisition and...
How Statsig just became a side project.
Statsig was acquired by OpenAI in September 2025 for $1.1 billion. While they continue to operate "independently," their founder now serves as OpenAI's CTO of Applications, creating questions about long-term roadmap priorities.
The collaboration tradeoff
While Statsig works great for engineering-led teams, it's narrow in scope. If your experimentation program involves marketers, product managers, and data analysts working together, you'll hit limits quickly. Their analytics focus on core experimentation metrics but lack the depth for broader business analysis.
Not enough collaboration features and minimal self-service capabilities for non-technical users mean most teams end up building additional tooling on top.
Here are 7 reasons to choose Optimizely Analytics over Statsig:
| Optimizely Analytics | Statsig | |
| Advanced statistical models | We continue to roll out and invest in the latest statistical methodologies like CUPED | Technical transparency, but may lack business-first context |
| Zero flicker, no slowdown | The most performant way to deliver variations with zero latency with Edge Delivery | Performance limitations can cause slower load times |
| Experimentation analytics | Connect user behavior to business outcomes directly in your warehouse, so you can finally prove what's working and accelerate growth | Warehouse-native but requires technical expertise; limited self-service capabilities for non-engineering teams |
| Modern editor | Our WYSIWYG editor is compatible with the latest JS frameworks 1,000+ customers running millions of experiments over a decade. | Requires custom coding for most variations; no visual editor for non-developers |
| Independent and stable roadmap | Customer-driven innovation, not subject to acquisition shifts | Now part of OpenAI's Applications team. Future priorities uncertain, will serve OpenAI's internal products first |
| AI not for the sake of it | With Opal variation generation, you can prompt an agent to create variation changes for you and stop bothering your busy devs | Still requires developer involvement for most variation creation |
| Pricing | Trusted long-term provider with consistent investment in enterprise success | Usage-based, may seem flexible but unpredictable at scale |
Complete feature comparison: Optimizely Analytics vs. Statsig
Statsig works if:
- Your experimentation program is purely engineering-driven
- You prefer focused, single-purpose tools
Consider Optimizely instead if:
- Cross-functional collaboration is essential to your experimentation program
- You prefer working with an independent vendor focused on experimentation and customer success
3. Optimizely vs. Eppo
Eppo is an experimentation platform similar to Statsig. They target technical teams who want to run experiments directly on their data warehouse.
Unlike platforms built for cross-functional use, Eppo's architecture requires significant data modeling and engineering resources. It makes adoption slower and less accessible for product managers, marketers, or other non-technical teams.
After being acquired by Datadog, resources are being redirected toward observability and infrastructure, creating uncertainty for customers who need a dedicated experimentation partner.
Setup challenges
At Eppo, you have to manually choose between sequential, Bayesian, or fixed-sample models and configure confidence levels and MDEs. This increases misconfiguration risk and makes experimentation less accessible for non-technical users.
Further, there is only support for control-vs-variant views, making A/B/n tests difficult to analyze. Results refresh once daily rather than in real-time, creating blind spots for underperforming tests.
Here are five reasons to pick Optimizely Analytics over Eppo:
| Optimizely Analytics | Eppo | |
| Purpose-built for all teams | Designed for cross-functional teams with intuitive tools for product managers, marketers, and developers | Built for technical users with a warehouse-native approach requiring data modeling and engineering support |
| Unmatched performance | Delivers real-time experiment results with world-class stats engine ready OOTB | Relies on daily batch updates and requires manual configuration of complex statistical models |
| Modern analytics | Built-in journey, funnel, and performance analytics with AI-powered insights | High-level reporting and dashboards, lacking a full funnel view of experiment performance |
| Proven enterprise maturity | 13+ years of experimentation expertise with advanced features like contextual bandits and ratio metrics | Early-stage platform without feature depth, minimal AI capabilities, and key features still missing |
| Clear, dedicated roadmap | Dedicated roadmap centered on experimentation, feature flags, and personalization | Future focus unclear after Datadog acquisition, shifting toward observability use cases |
Eppo works if:
- You don't need comprehensive product analytics, just experimentation metrics
- Your data engineering team can handle complex setup and ongoing maintenance
- You're comfortable with manual statistical model configuration
- Basic control-vs-variant reporting meets your needs
- Daily result updates are sufficient for your testing cadence
Consider Optimizely instead if:
- You need rich product analytics alongside experimentation
- You need automatic statistical rigor without manual configuration
- You want to compare multiple variants in the same view
- Real-time results matter for quick decision-making
- You need to build QBR dashboards with complex ROI calculations
Most analytics tools aren't built for (all) your data...
Your experiment results live in one system. Your revenue data sits in another. Customer lifecycle metrics are somewhere else entirely. When you need to connect A/B test performance to actual business outcomes like churn or lifetime value, you hit a wall.
Traditional experimentation platforms either lock your data into their tracking systems or require complex data modeling before you can run tests. Want to see how that homepage experiment affected six-month retention? You'll need ETL (Extract, Transform, Load), custom data pipelines, and weeks of engineering time.
The result: Duplicated data, escalating costs, and data teams who became experiment setup machines instead of strategic advisors.
While everyone expects you to be a data engineer to run experiments. We don't.
So, we took a different path with Optimizely Analytics. Instead of retrofitting, we acquired NetSpring - best-in-class warehouse-native analytics architecture and built everything to work together from the ground up. Now we're layering AI in analytics on top of this solid foundation.
It's experimentation + analytics that work with your existing data stack, with zero data duplication.

Source: Optimizely
What this means for you:
-
Self-service without limits: Your teams can analyze trustworthy results on all your data, not just what fits into someone else's tracking model.
-
Release your geniuses from the queue: Your data team stops being human dashboard generators and becomes strategic advisors.
-
Zero data duplication: Warehouse-native architecture that works with your existing infrastructure, including Snowflake, Databricks, BigQuery, and Redshift, whatever you've invested in.
-
Unified platform: Experimentation, analytics, feature flags, and personalization working together instead of requiring integration gymnastics.
While competitors rush to add basic AI features, at Optimizely, we believe AI isn't a nice-to-have. It's essential to scale your program and increase program velocity.
Three actual use cases to help you drive business impact:
1. Chat with your data
Ask questions like "Which features do enterprise customers adopt fastest?" in plain language and get instant visualizations without knowing schemas or SQL.
Image source: Optimizely
2. Exploration summaries
Click any chart to get business-context explanations.
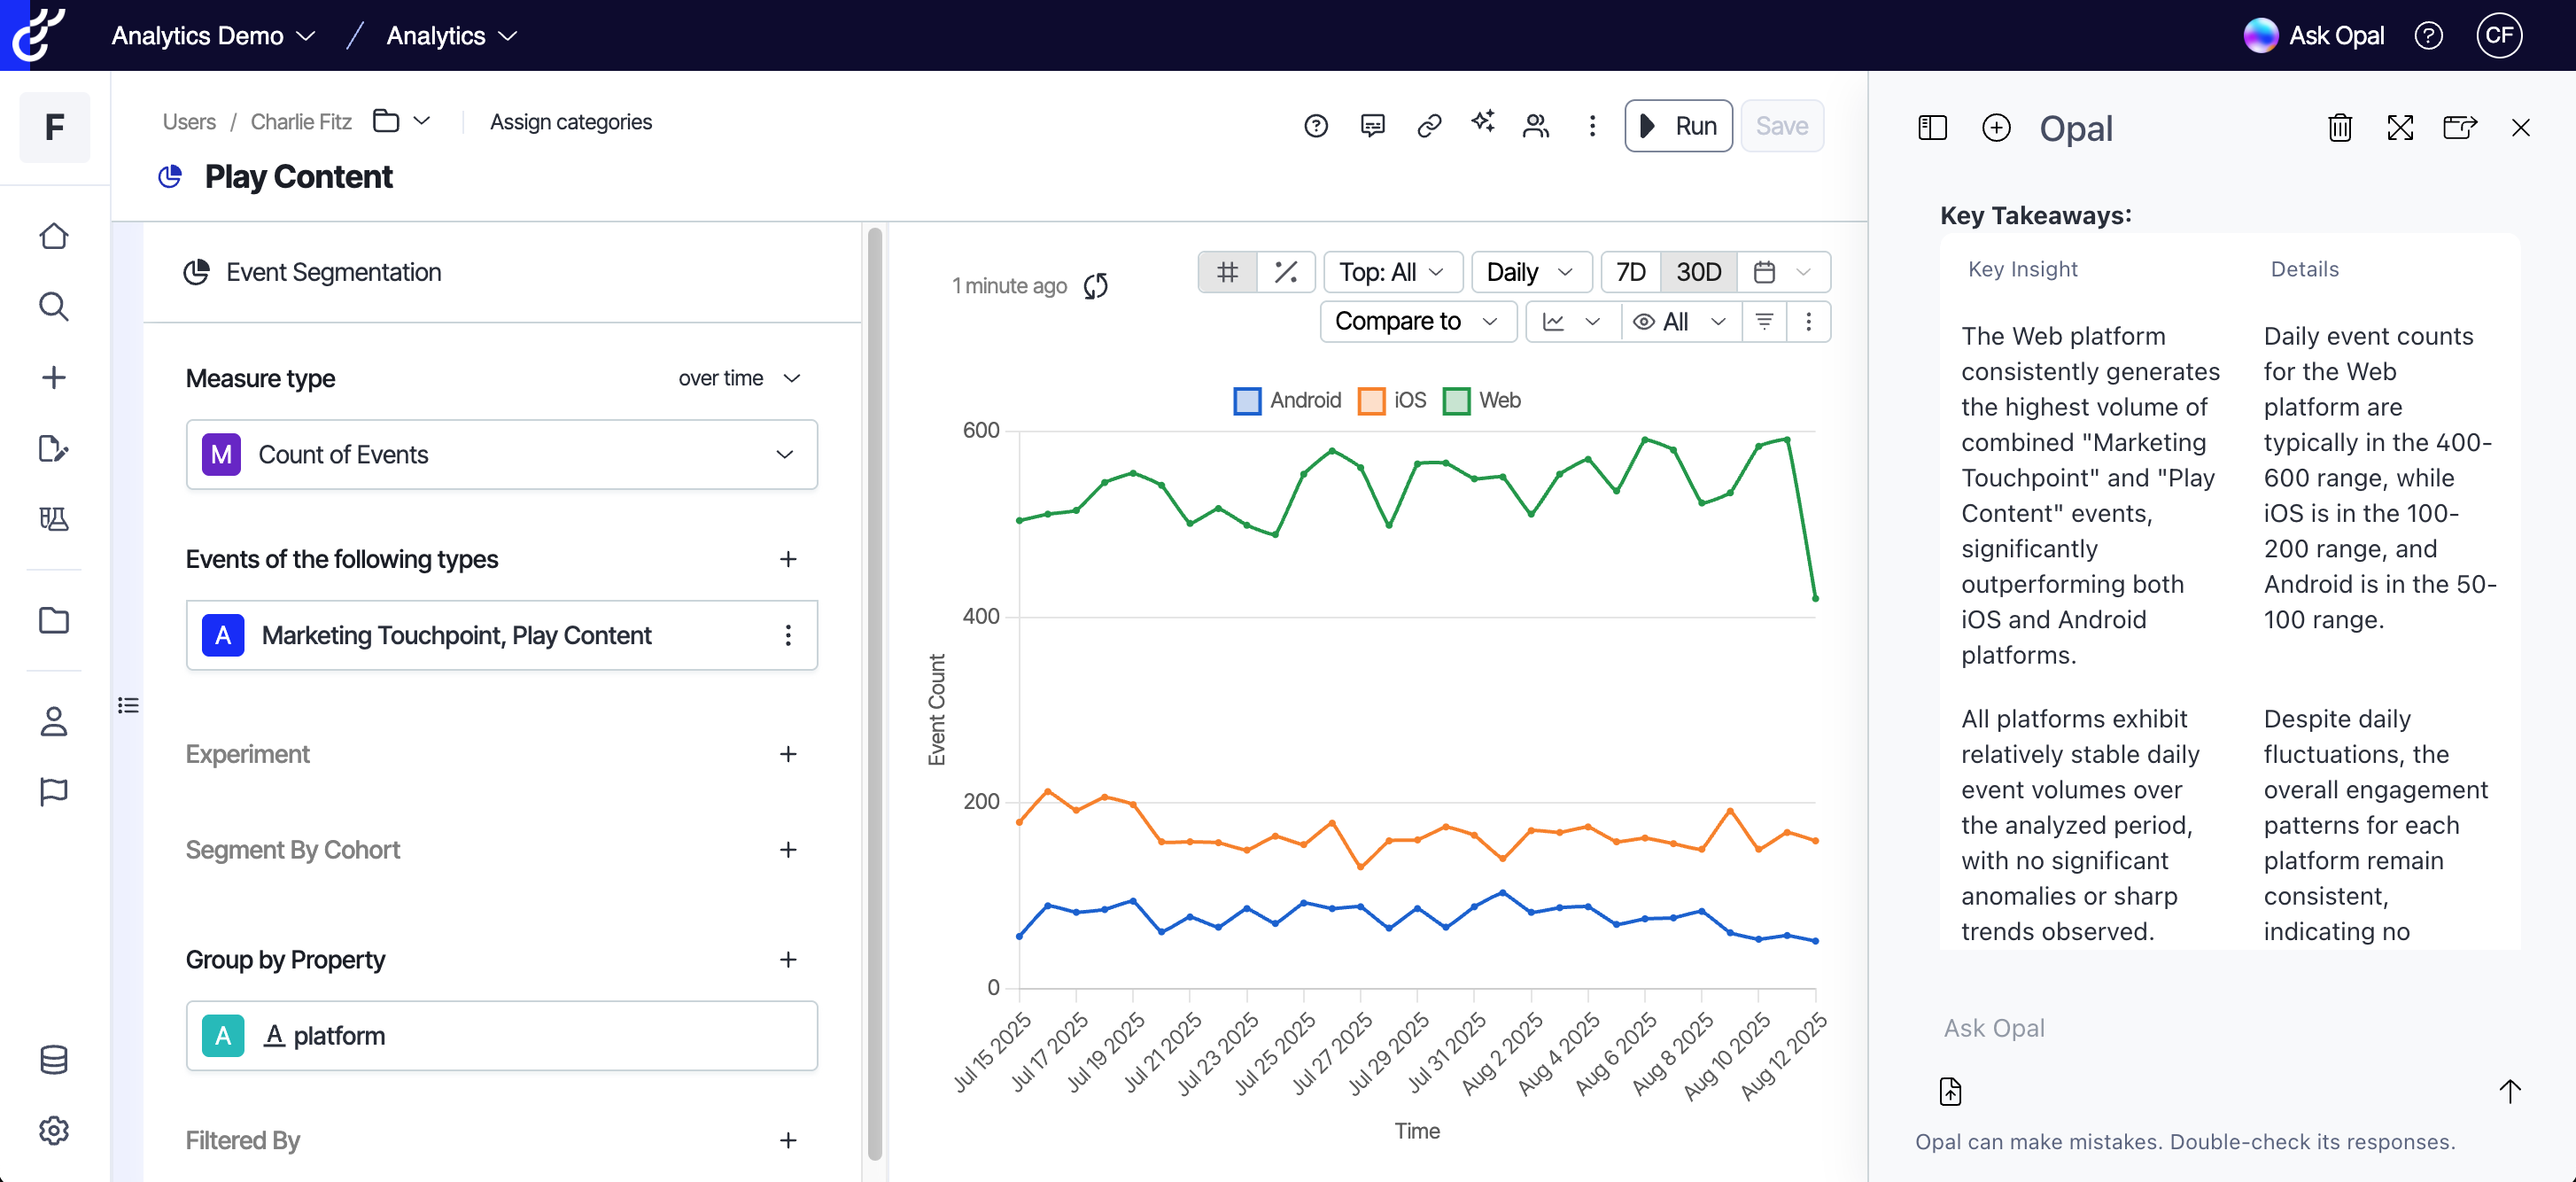
Image source: Optimizely
After AI has created a couple of explorations for you, creating your own becomes much simpler.
From there, you can use the built-in visualization templates to start with an empty template and utilize various explorations to tailor your dashboard and reporting needs.
3. AI agents
Our AI agents are already transforming how teams run experiments:
- Experiment ideation agent: It analyzes your complete dataset to generate high-value test ideas based on actual user behavior patterns, drop-off points, and conversion data, not gut feelings.
- Experiment planning agent: It recommends metrics that reach statistical significance faster by analyzing your traffic patterns and business context, cutting planning time by 19%.
- Variation development agent: It builds production-ready components—countdown timers, navigation buttons, form variations in minutes without developer resources, helping teams launch experiments 60% faster.
- Results summary agent: It automatically generates polished PDF reports with conversion insights and next-step recommendations, instantly delivered to stakeholders while results are still actionable.
Wrapping up...
While competitors rush to add AI features on flawed foundations, we built the architecture right first.
We're not just asking "what should we test?" but "how do we connect test results to the business outcomes that matter?"
Then, giving you the tools to find those answers in your existing data infrastructure.
Your warehouse has the data. Your experiments have the insights. Choose a platform that connects them directly.
See Optimizely Analytics in action
Häufig gestellte Fragen zum A/B-Testing

Ja, ein Vermarkter und ein Werbetexter... aber lahmer als die meisten. Ich versuche, KI zu nutzen und hier ein Denker und nicht nur ein Verleger zu sein, aber eigentlich...
- Zuletzt geändert: 25.11.2025 06:52:07