Experimentation analytics: Why teams don't trust their own results, and what you need

Your dashboards look great. Your test velocity is high. Your statistical rigor is solid.
But then leadership asks the one question that stops everyone cold: "How much revenue did this generate?"
That's when teams realize they're celebrating engagement "wins" while the data that proves actual business impact sits disconnected in their warehouse.
The result? Frustrated leadership, questioned ROI, and experimentation programs that can't connect to business outcomes.
Here's how experimentation analytics can help you stop being trapped in data channels that you can't easily access when decisions need to be made.
The infrastructure paradox we're witnessing
Modern experimentation teams seem to be winning infrastructure:
- Test velocity has dramatically improved; top-performing teams now run 200+ experiments annually compared to the median of just 34
- Statistical confidence in experiment results has dramatically improved
- Teams have invested heavily in experimentation platforms, processes and building a strong culture of experimentation
However, walk into any team running experiments, and you'll hear some version of this story:
"Our testing platform shows engagement wins, but all the revenue data lives elsewhere. When we try to connect them, the numbers don't match between systems.
We either ship variations based on metrics that don't predict business impact, or we declare results 'inconclusive' when we can't prove commercial value."
This disconnect between testing activity and business impact is the experimentation intelligence gap. Teams can prove statistical significance on engagement metrics, but they're missing the insights that drive growth:
- Only 32% of organizations achieve true self-service analytics (Gartner, 2024)
- Business users still wait 7-10 days for new reports (ThoughtSpot Research, 2024)
- Data analysts spend 70% of their time on report building versus strategic analysis (McKinsey, 2024)
This isn't a failure of your experimentation program. It’s that the journey to true business impact was never completed.
Shafqat Islam, President, Optimizely, shares the problem with testing on superficial data and what customers are now testing.
The broken workflow burning out your analytics team
Here's the pattern we see everywhere:
1. Business context data lives securely in the warehouse, but it's inaccessible
Teams operate on intuition rather than using prior experimentation results combined with business metrics to inform what should be tested next.
2. Can't test against events and metrics in other channels, leaving you with leading indicators
Tests focus on engagement signals instead of measuring true business outcomes. This problem is getting worse as AI changes discovery patterns. With ChatGPT and AI search taking over, clicks are becoming less predictive of business value. The metrics that will matter most—revenue, retention, customer lifetime value are exactly the ones trapped in your warehouse.
Plus, you'll have to adapt. For example, watch for the "crocodile effect" where clicks decline, but impressions increase. It's your strongest signal that AI is consuming your content without sending traffic.
3. Analyst backlogs are deep
Workflows take days (or weeks) and delay important projects. Data scientists are writing custom code for every single experiment because business metrics live in the warehouse, while test results live elsewhere.
We've heard from customers whose product leadership rejected this approach entirely: "It doesn't scale."
4. Data disperancy across systems creates uncertainty and decreases trust in the result
And yet, in 2025, some teams are still manually analyzing experiments in Excel, one test at a time. The opportunity cost is enormous.
5. Ship "winners" based on incomplete pictures
Teams either ship variations based on metrics that don't predict business impact or declare results "inconclusive" when they can't connect test outcomes to business metrics.
6. Repeat the cycle while business outcomes stagnate
Both approaches result in frustrated teams and leadership convinced that testing isn't driving results.
But you’re missing out on a lot when your data lives in silos...
Consider these scenarios we see playing out in organizations right now:
- Your product team discovers that an onboarding experiment increased trial-to-paid conversion by 8%. Three weeks later, warehouse analysis reveals it primarily converted users who churned within 60 days. The variation that showed slightly lower immediate conversion drove 23% higher lifetime value.
- Your Head of Growth wants to understand which experiment variations drive not just conversion, but actual customer lifetime value. The warehouse contains behavioral data, subscription data, and experiment results, but combining them into insights requires your data team to build a custom analysis that takes weeks.
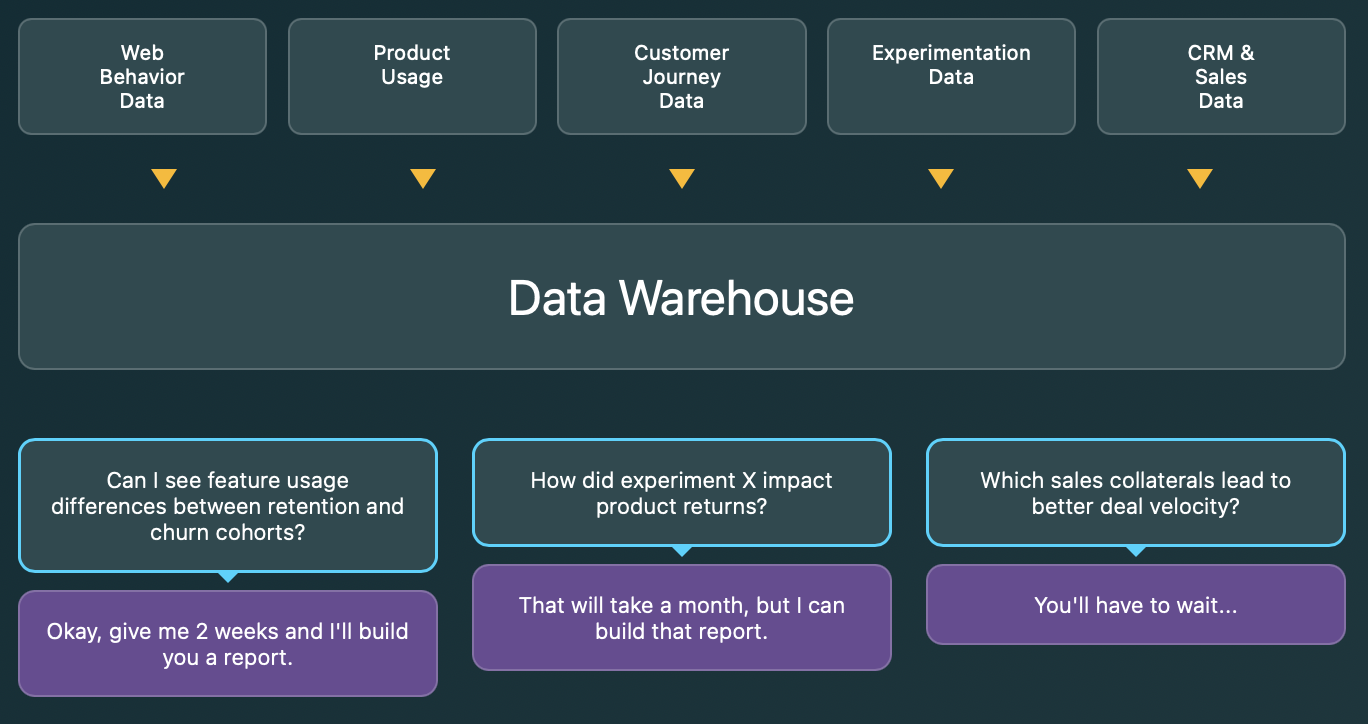
Image source: Optimizely
The cost of managing cross channel data that can't speak to each other
Your team might be losing if they're using multiple tools that don't speak to each other, requiring constant data reconciliation and creating different points of failure.
- Data scientists become human dashboard generators: They're writing custom code for every single experiment because business metrics live in the data warehouse, while experiment data lives in separate tools.
- Manual analysis creates massive bottlenecks: Teams spend hours generating experiment dashboards that should be instant, while analysts become reactive report builders instead of strategic advisors.
- Data discrepancies erode decision confidence: When experiment results from your testing tool show a 15% lift but warehouse data shows flat revenue, which do you trust?
- Critical business insights stay invisible: You can't see where your revenue-producing cohorts spend time during experiments, the exact insight that should inform your product investment decisions.
- Limited experiment scope: Traditional experimentation is limited to clicks, page views, and basic custom events. You can't experiment on real business processes like rental car experiences, SDR messaging flows, or complex offline-to-online customer journeys.
Vijay Ganesan, VP, Software Engineering, shares how to manage cross-channel data
Experimentation analytics isn't just about better dashboards
When every department head can access unified data directly, including experimentation teams analyzing impact on retention, product teams analyzing feature adoption, and operations optimizing based on real-time metrics, decision velocity increases dramatically.
For you, it means:
- Self-service analytics, warehouse powered: Works with Snowflake, Databricks, Google BigQuery, and Amazon Redshift.
- Flexible modeling and exploratory deep dives: Support advanced metric types like ratio and percentile metrics.
- Leverage your single source of truth: Zero data duplication, infinite analysis possibilities.
- Analyze across all your events and business data: Build any calculation on your full dataset.
As per Harvard Business Review Research, organizations with true self-service analytics make decisions 5x faster than those dependent on analyst intermediation.
While competitors wait weeks for market analysis reports, you can:
- Make faster decisions by reducing dependencies on analysts
- Create impact by tying experiments to revenue, churn, and retention
- See full journey views, not just leading indicators
- Keep privacy, security, and compliance at the core to get trusted + secure data
This is the fundamental advantage of a unified platform over managing multiple disconnected tools. You experiment anywhere, then use analytics to dig deeper and drive personalization. It's a loop; you need all of these things working together. Experimentation shows you what works, analytics reveals why it works and for whom, AI accelerates the entire process, and personalization scales the winning insights.
And this is exactly how Optimizely is solving this problem.
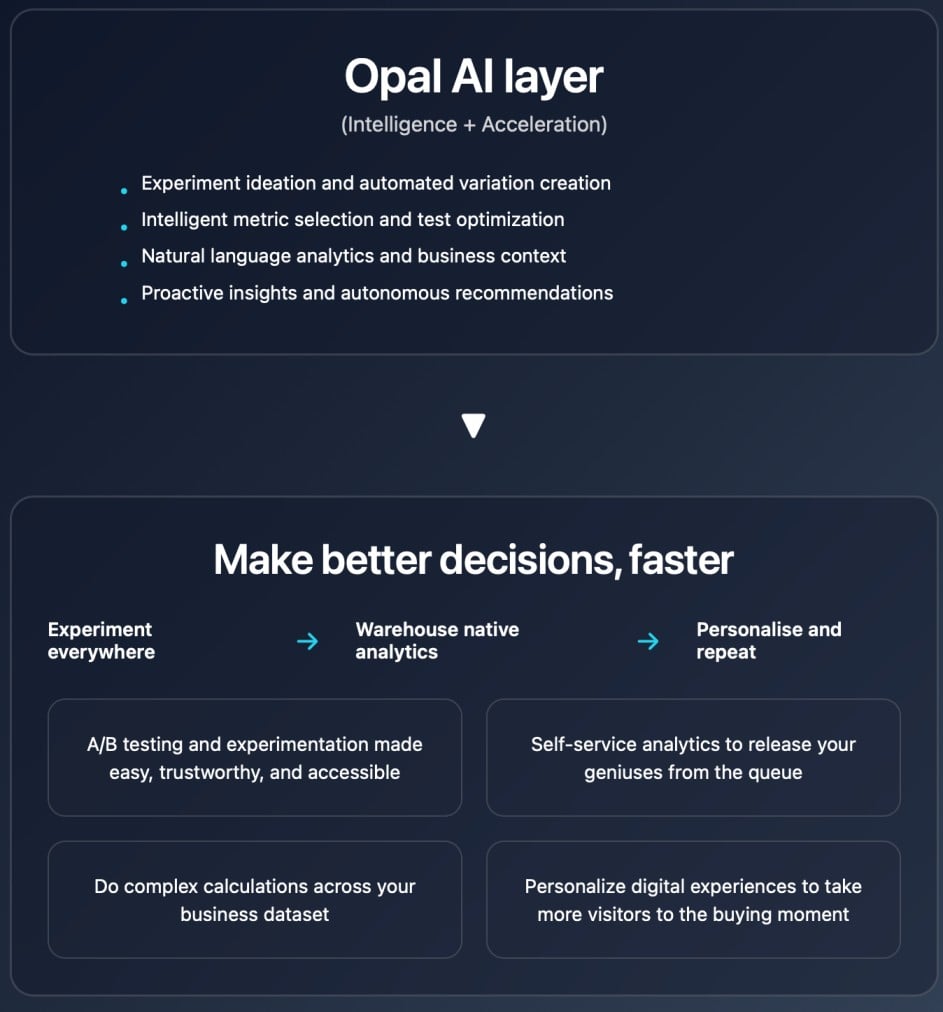
Image source: Optimizely
The alternative is managing multiple vendor relationships, data inconsistencies, and integration complexity while your competitors move faster with unified platforms.
What happens when all your data lives in one place...
When your experiment data and business metrics live in the same place, the entire dynamic shifts:
1. Stop explaining why the numbers don't match
No more discrepancies between your experimentation platform and warehouse data. No more manual data reconciliation. No more awkward conversations with leadership about conflicting results.
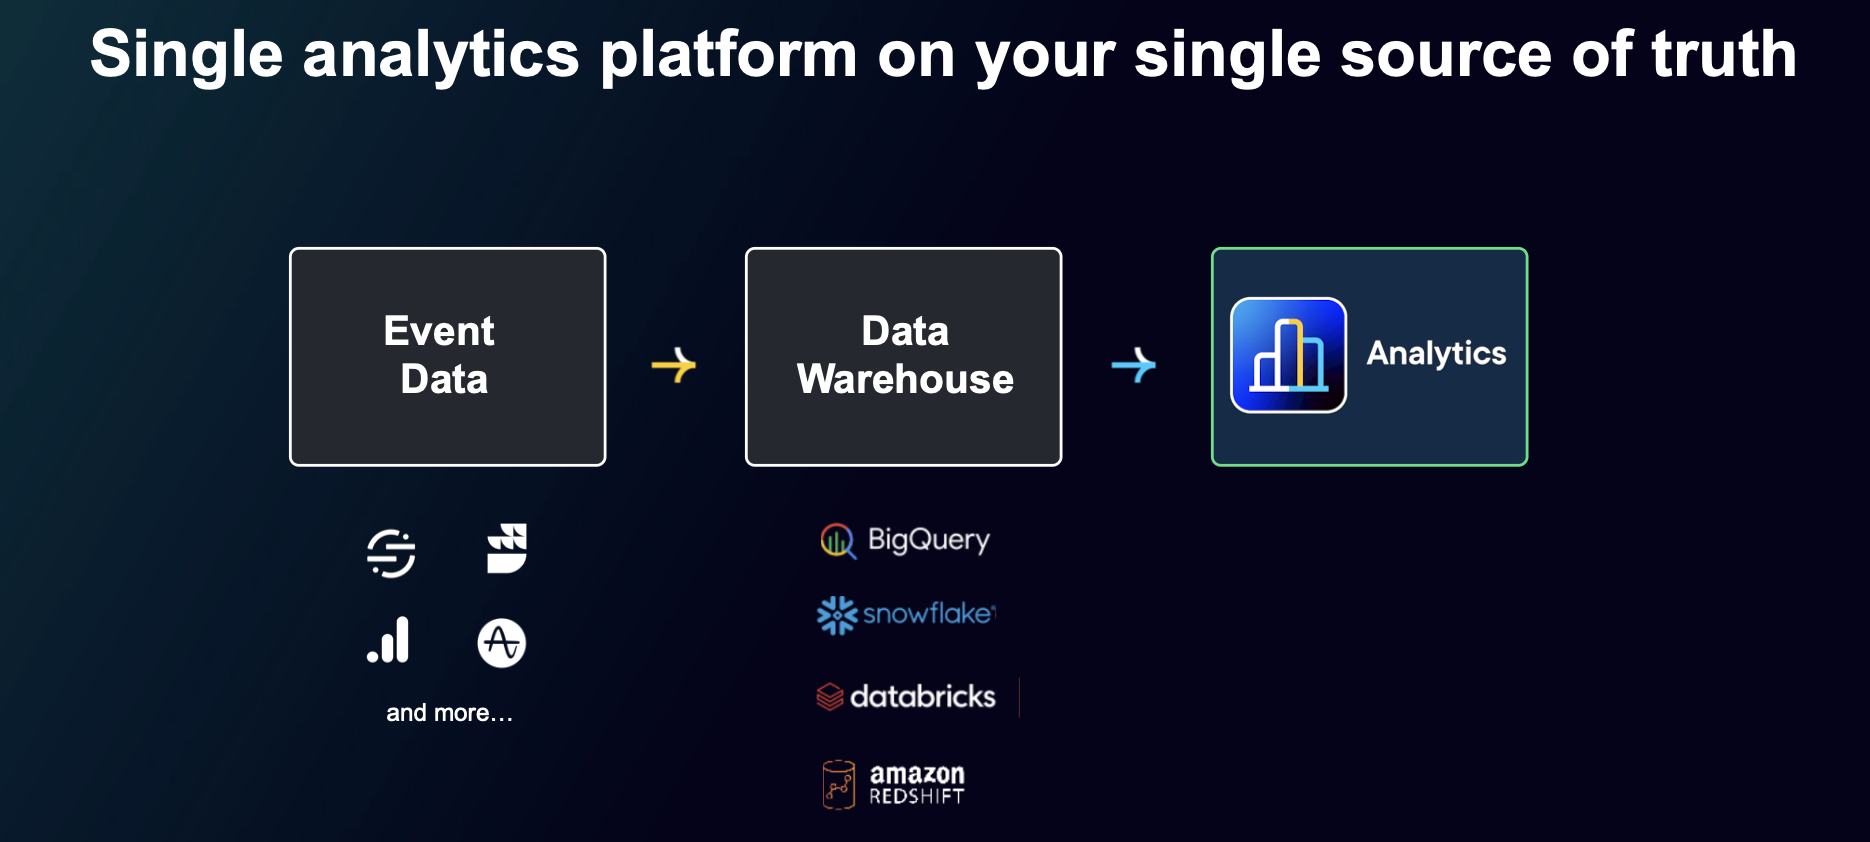
Image source: Optimizely
2. Finally, answer leadership's revenue questions...
Without waiting for your data team. You get comprehensive experiment dashboards without waiting for data science resources or dealing with manual reporting bottlenecks. What used to take 4-8 hours now happens in minutes.
3. Present with reason in your next executive review
Revenue impact becomes visible in real-time. You can create cohorts of your top revenue-producing customers and see exactly where they spend time during experiments. Walk into leadership meetings with concrete answers about which tests drove actual business value, not just engagement lifts.
4. Test your real business processes, not just website clicks
You can now track any metric in any experiment, regardless of how the metric was recorded. In the past, you could only send events to specific APIs directly, so experimentation platforms could only record clicks, page views, or custom events that required implementation.
Now, anything your customer is already recording from any source can be included. Think of a rental car company doing tests on real-life customer experiences, or an enterprise A/B testing their SDR flows to see which messaging gets them more leads. Any event that exists can now be tied to an experiment, even if it isn't tracked on an app or website.
5. Get answers without learning SQL
Hypothesis generation becomes data-informed instead of hunch-driven with AI analytics. Now you can combine product analytics with CRM data without any coding. No SQL needed, no analyst queue, no data transfers, and no compromise on governance or security.
Here's an example of feature usage dashboard example combining product analytics with CRM data:

Image source: Optimizely
Exploration templates let you start from scratch and build custom dashboards. Since it connects directly to your data warehouse without moving data, you can self-serve analytics.
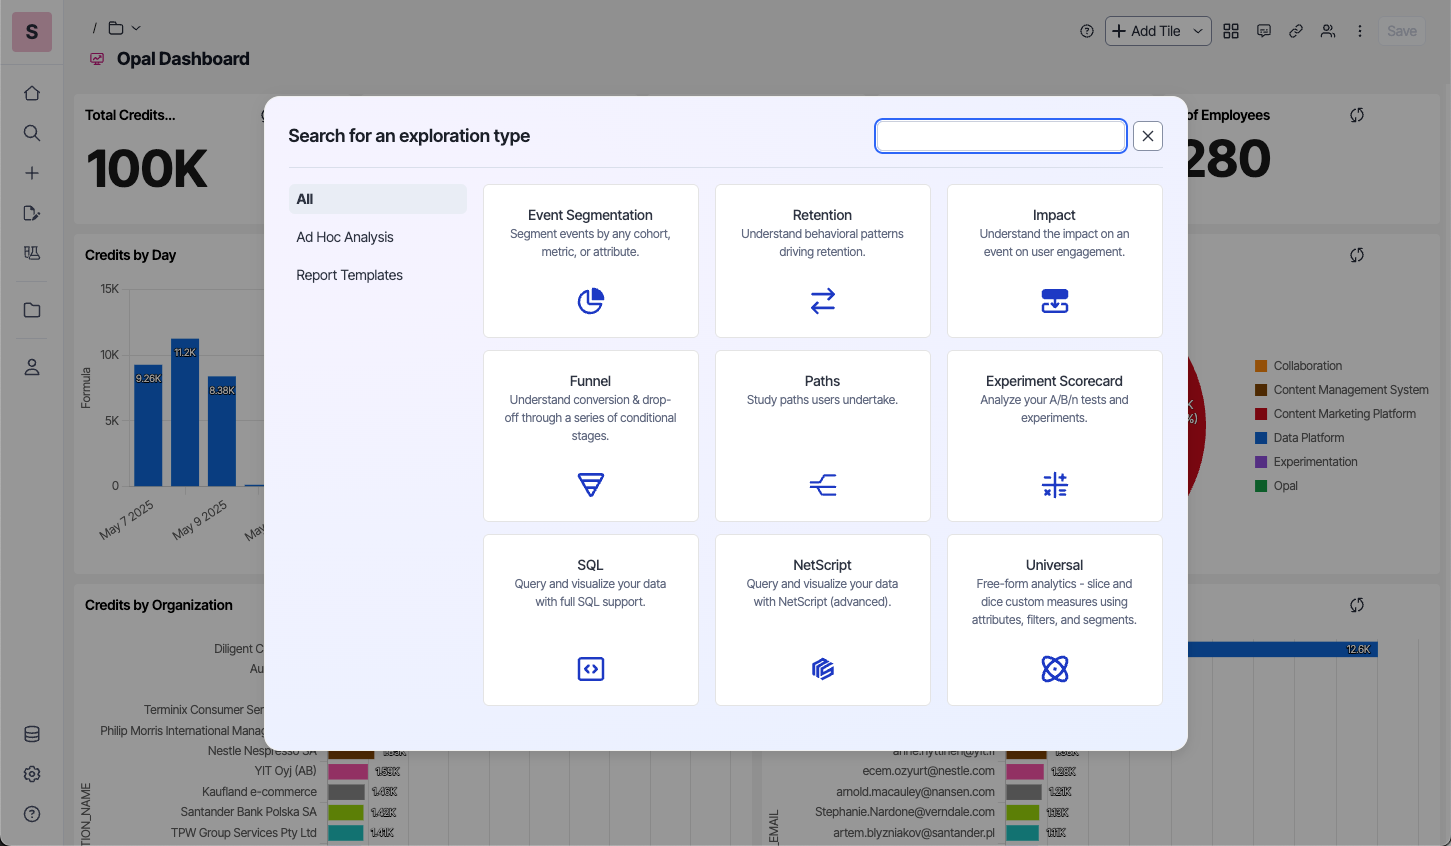
Image source: Built-in exploration templates within Optimizely Analytics
Your analysts can go from being report builders to being strategic advisors. They can focus on predictive modeling and advanced segmentation instead of building the same conversion analysis every week.
The alternative to warehouse native analytics is hiring SQL analysts and engineers to build custom warehouse reports for every experiment. That approach is costly and doesn't scale.
What right looks like: 5 ways to close the gaps
Even if you're not ready for full warehouse-native experimentation, here's how to close the gap:
- Map your current experiment-to-analysis workflow: Identify where experimentation data diverges from business metrics. Ask: Where are we losing visibility? Who owns what steps?
- Time your business impact analysis: How long does it take to answer: "Did this experiment increase revenue?" Treat that response time as a KPI worth improving.
- Shift your success metrics: Move beyond engagement metrics. Start attaching experiments to lagging indicators like retention, revenue per user, and customer lifetime value, even if manually at first.
- Create a shared "source of truth" dashboard: Build a basic version inside your warehouse or business intelligence layer that combines test metadata with downstream business impact, even if it's updated weekly instead of in real-time.
- Connect your biggest tests first: Don't try to fix everything at once. Start with experiments that could significantly impact customer lifetime value, retention, or revenue per user.
How long can you afford to celebrate engagement wins while revenue impact remains invisible?
The data is already there. The insights are already possible. The only thing missing is access.
If your experimentation program can't tie results to revenue, retention, or customer value, you're not just missing insights; you're missing influence.
Here's how Optimizely Analytics can power smarter business decisions:
- You can continuously monitor experiment results without inflating the positive false rate.
- You can support measurement and interference of advanced metric types such as ratio metrics and percentile metrics.
- You can use CUPED (Controlled-experiment Using Pre-Experiment Data) to enhance the sensitivity of A/B tests by reducing variance, enabling faster and more reliable statistical significance.
- You can use global holdouts to measure and report on the cumulative impact of your testing program by withholding a percentage of your audience from testing.
In a world where every team is A/B testing, the real advantage isn't running more experiments. It's knowing which ones move the business forward, before your competitors do.

Ja, en markedsfører og en tekstforfatter ... men mer lam enn de fleste. Jeg prøver å bruke AI og her å være en tenker i stedet for bare en publisist, men egentlig...
- Sist oppdatert:12.11.2025 10:38:08