
Most product teams face a common challenge: understanding which metrics and behaviors actually drive their key outcomes. You might ship a feature that moves your north star metric, but without systematic analysis, it’s hard to know whether you’re measuring the right things or if the features you’re building are having the impact you expect.
Typically, answering perennial questions like "which metric best predicts retention?" or "which user behaviors correlate with conversion?" and deciding where in the experience to run your next experiment (and to whom) requires either educated guesswork or dedicated time from a data scientist to run correlation analyses.
The Influence Exploration lets you answer these important questions confidently without requiring a background in statistics or days of waiting. Whether you're a PM, Experimentation Team, or Analyst, the Influence Exploration Template allows you to see correlations between important metrics quickly and clearly.
The questions you’re actually trying to answer
“What causes the business results we care about?”
Is it total hours watched or number of titles watched that predicts 6-month retention? You could guess, or you could know.
“Who are our users and how do they differ?”
Are users who complete profile customization more likely to become power users than those who connect social accounts? The difference matters when you’re prioritizing roadmap.
“What happens after users do something important?”
What behaviors cluster around sharing a referral link in the following 7 days? Understanding this tells you where to double down.
These aren’t abstract questions. They determine what you build next and whether it’ll work.
How it works
The Influence Exploration analyzes relationships between behaviors, cohorts, and metrics on your actor dataset such as users, accounts, whatever or matters to your business. It supports nine different analysis types by combining any target (event, cohort, or metric) with any test (event, cohort, or metric).
The template surfaces four key measures:
- Likelihood impact:How much more likely actors who did the test event are to hit the target event. +50% means they’re 50% more likely to convert, retain, or whatever outcome you’re measuring.
- Metric impact: The percentage difference in average metric value between actors who did something and those who didn’t. When this shows +45%, actors in the test cohort have 45% higher metric values.
- % of actors who did test event: Reach matters. A behavior that impacts 2% of users is different from one that touches 40%.
- Correlation (R²): How tightly two metrics move together, from 0 (no relationship) to 1 (perfect relationship). At 0.64, the test metric explains 64% of variation in your target.
The template answers two core questions: If a user does X, how likely are they to do Y (and how many users does this touch)? And how strongly does one metric predict another?
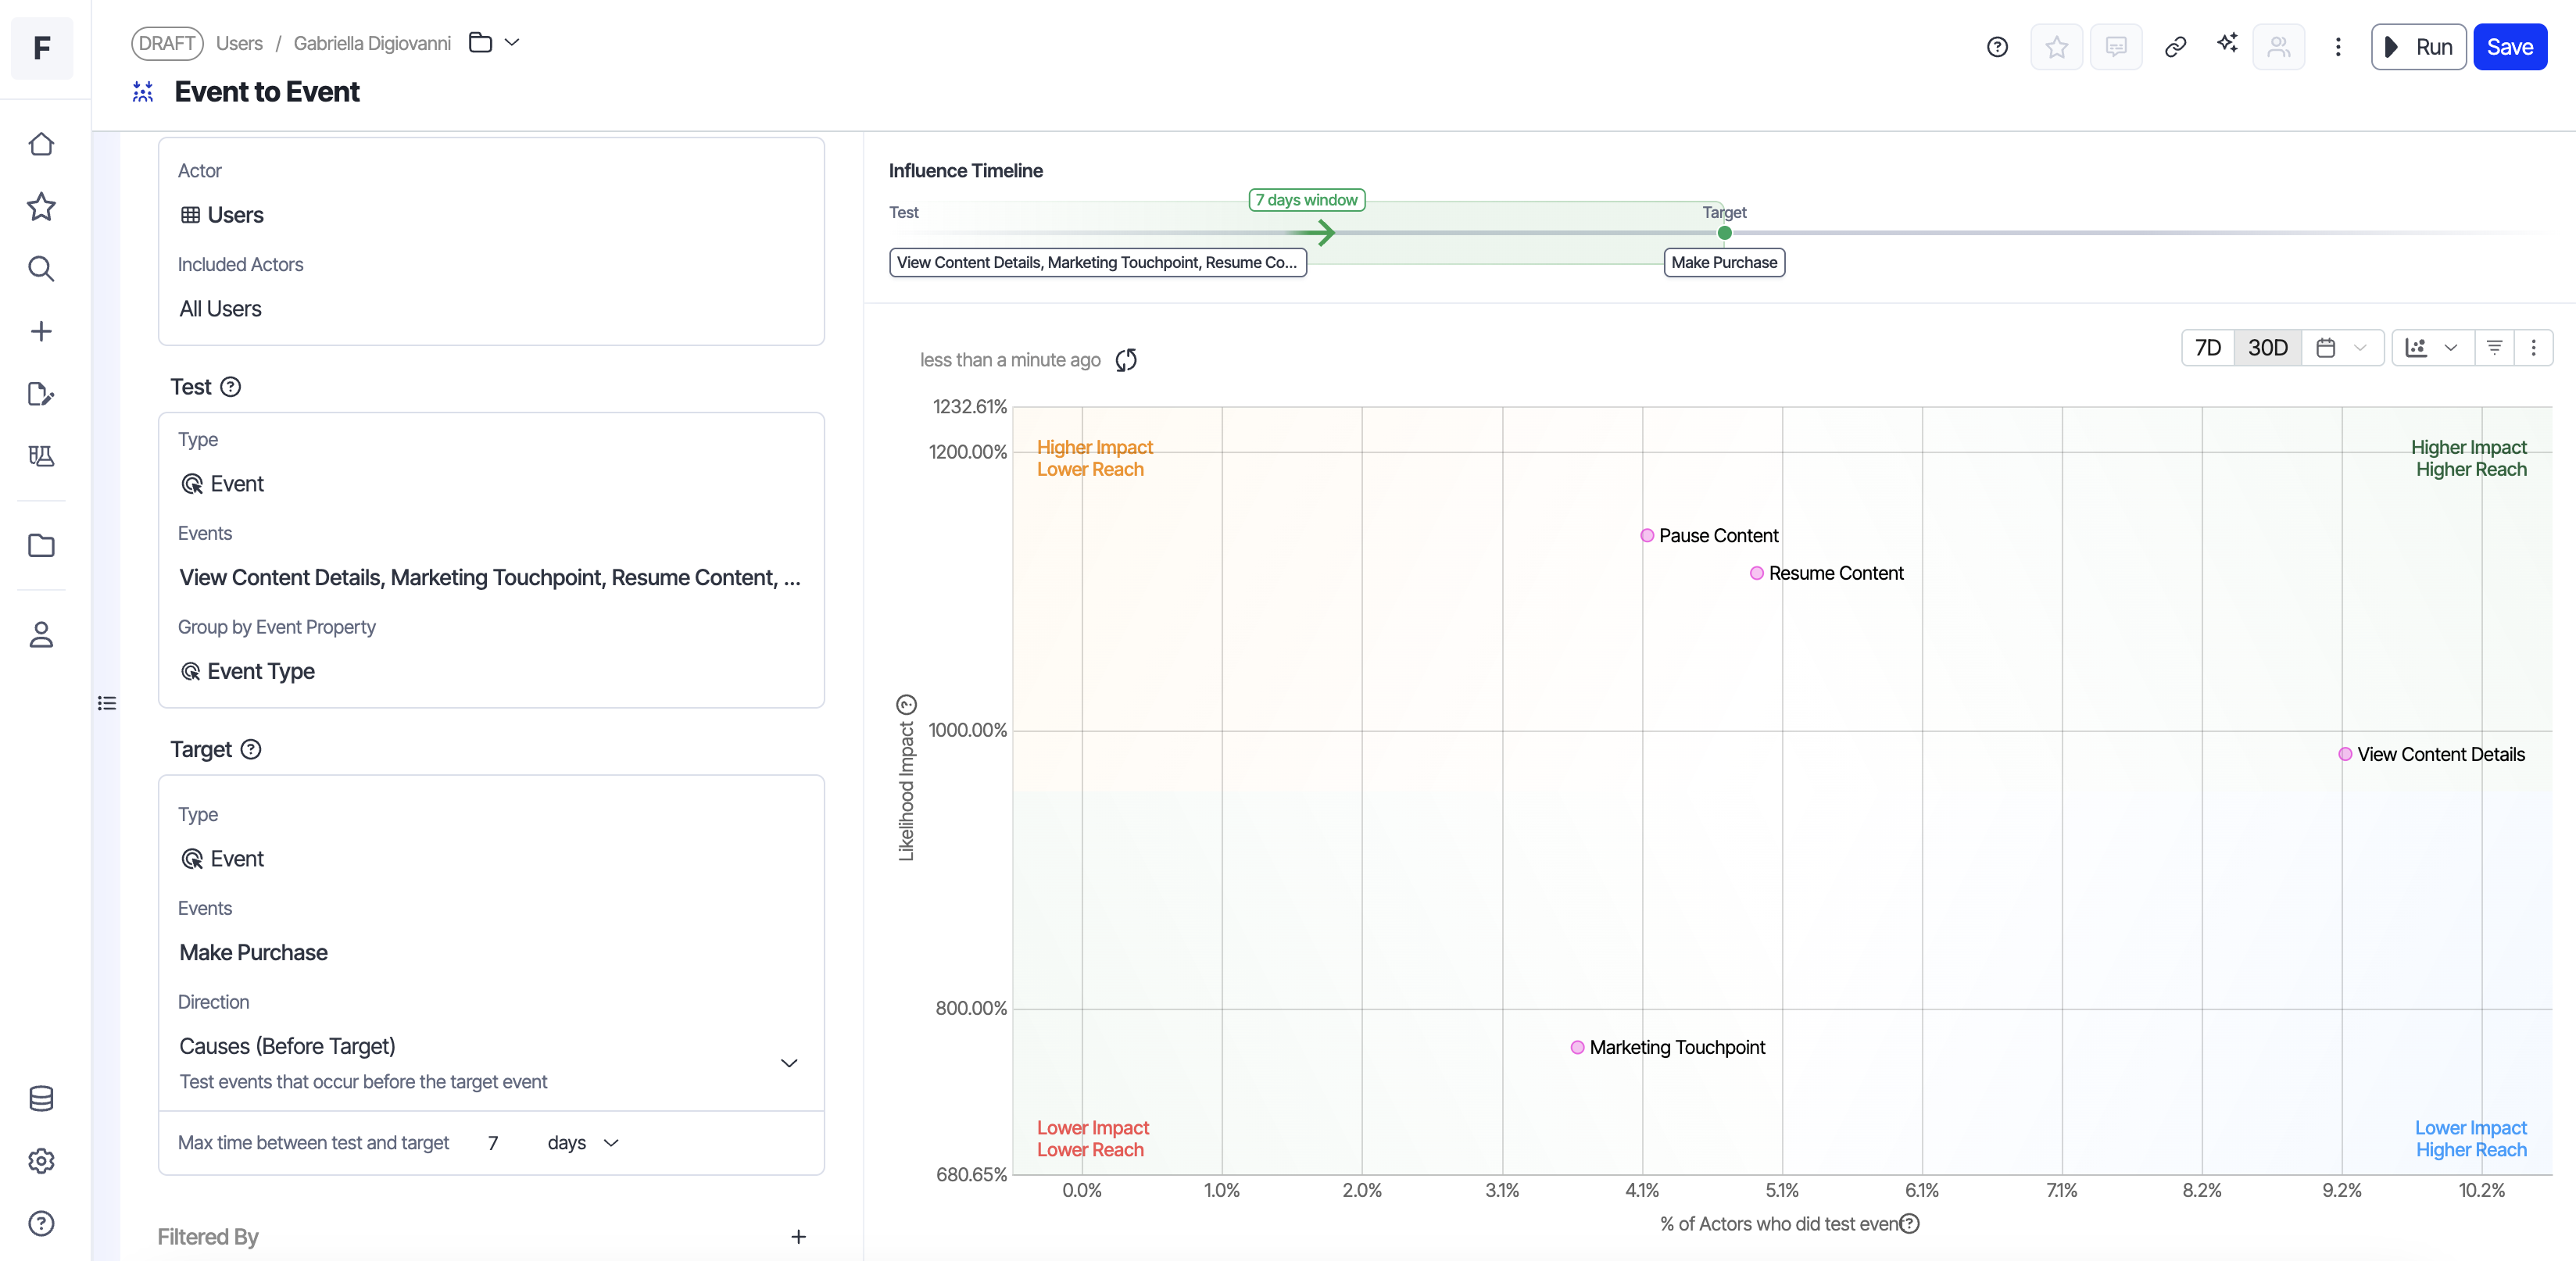
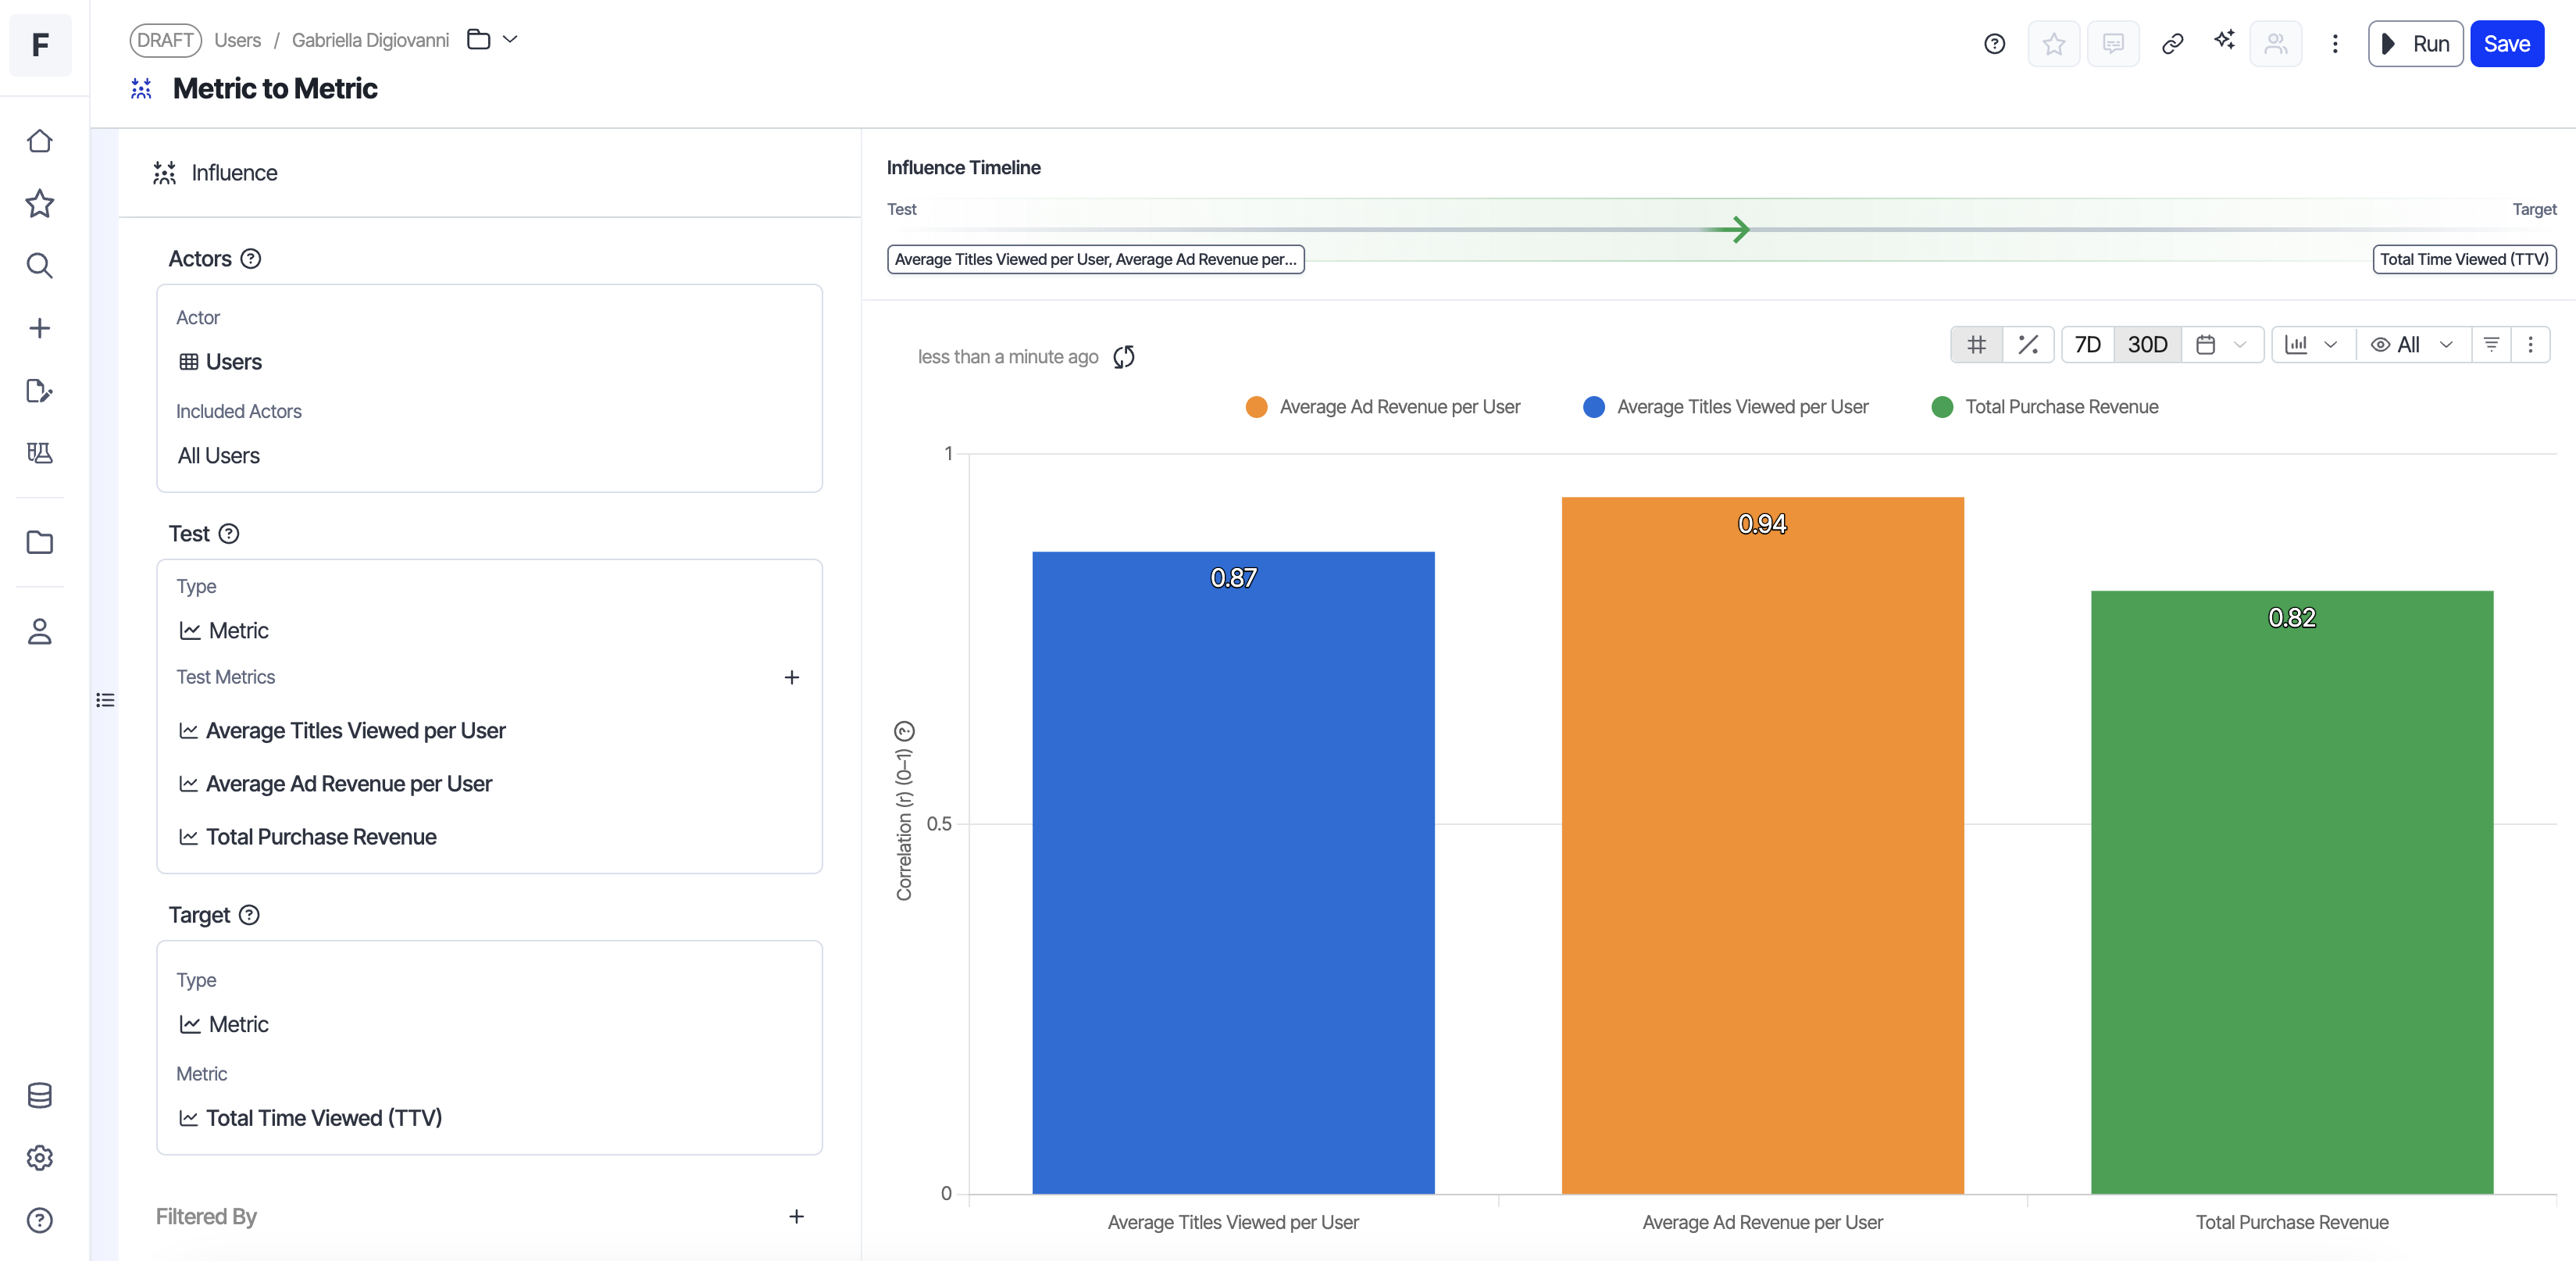
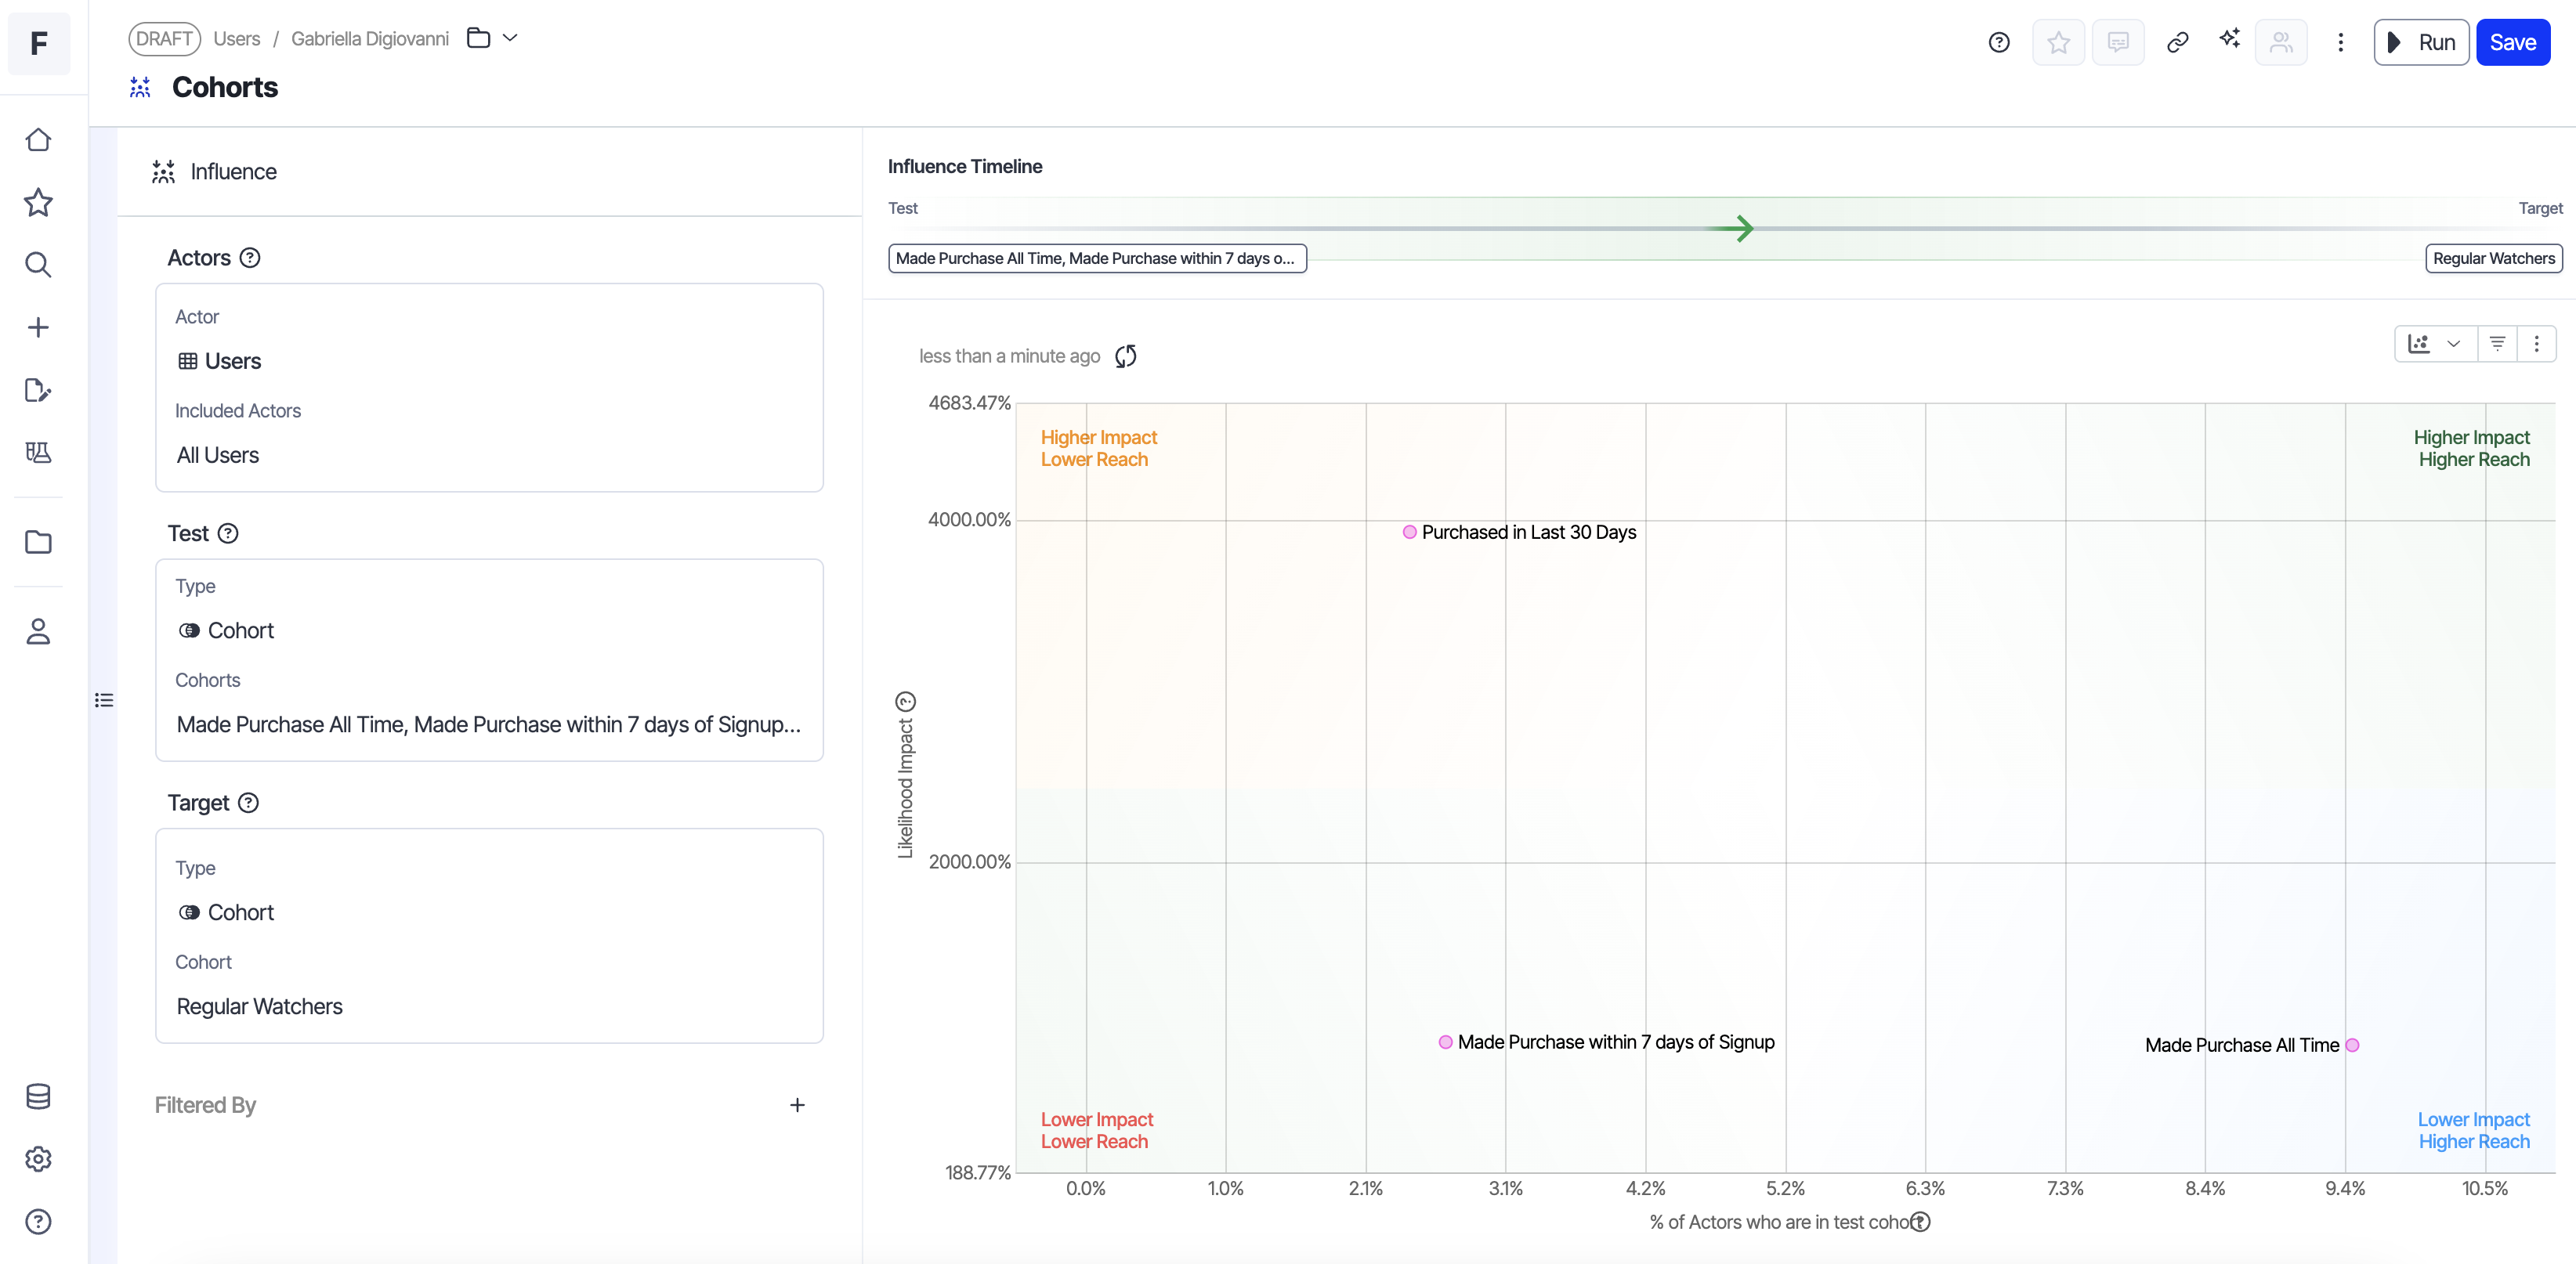
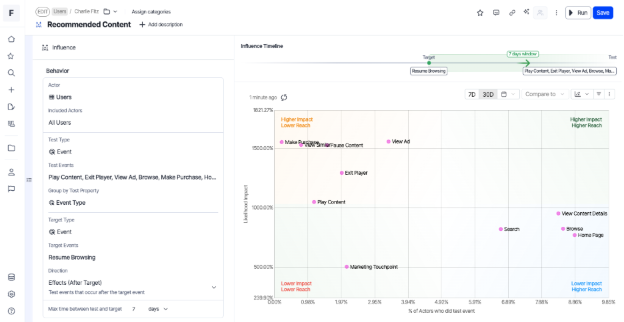 Image source: Optimizely