The simulation results suggest:
- When testing absolute mean difference, the Absolute-Difference Approximation for planning sample size matchesour goal of 80% power. On the other hand, the Delta Method tends to overestimate the sample sizes needed.
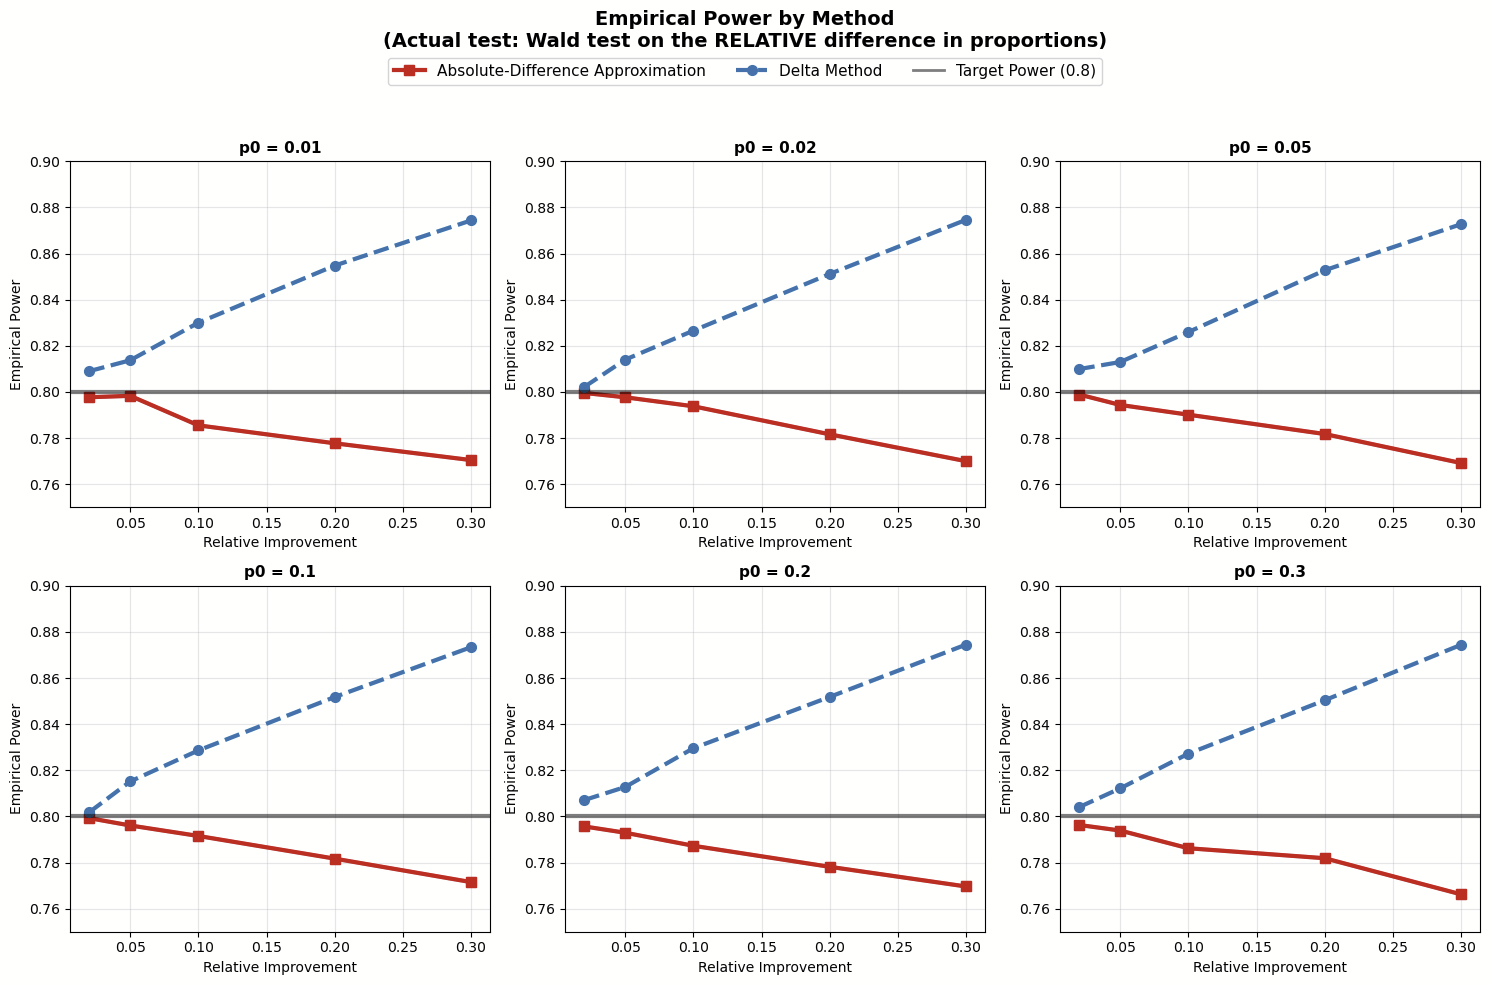
- When testing relative mean difference with the delta method, the Absolute-Difference Approximation usually underestimates the sample sizes because it underestimates the variance. The problem of being underpowered gets worse as the relative improvement grows.
These findings highlight our suggested best practice earlier: make sure your sample size estimation matches the statistical test you plan to use. If you're using an absolute difference test to estimate a relative difference test, go with the Absolute-Difference Approximation for your sample size. But if you run the relative difference test directly using the delta method, then use that method to estimate sample size. (Picking between these two tests for relative improvement is beyond the scope of this post, but just know that the approximation test skips over some uncertainty in the denominator and isn't the best choice in the industry.)
At Optimizely, we use the delta method to test relative improvement, so our sample size estimation also uses the delta method.
What sample size formulas tell about sample size reduction
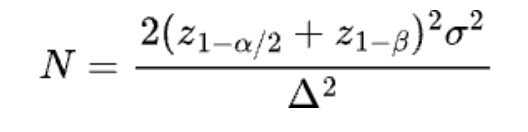
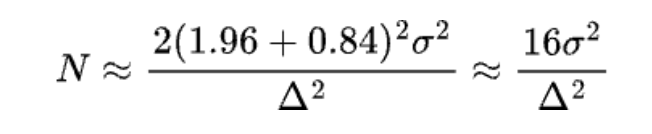
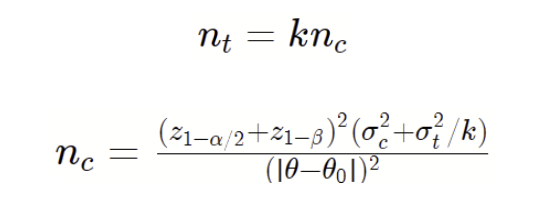
When people plan sample sizes, they usually want them as small as possible to keep experiments quick. Two importantfactors that influence sample size often get missed in sample size formulas: the minimum detectable effect (MDE) in the denominator and the metric variance in the numerator. These factors can actually help lower the needed sample size. In all formulas, if we fix α at 0.05 and β at 0.2 (80% power), having lower metric variance or/and a bigger MDE means you need a smaller sample size.
This brings up two practical tips:
- Once you’ve identified candidate metrics that your experimental changes can actually move and that the business cares about the most, you can look at historical data to pick the metric with lower variance as the primary metric. (With historical data, you might be able to reduce sample size further by using techniques like CUPED)
- If stakeholders are rushing you, explain that choosing a bigger MDE can help finish the experiment on time. Butthey should know this means there's a higher chance of missing small effects, so they might want to rethink whatthe experiment is for. And whatever MDE you pick must still be realistic — inflating it beyond what’s plausible simply to finish sooner makes the experiment meaningless.
References
Chow, S. C., Shao, J., Wang, H., & Lokhnygina, Y. (2017). Sample size calculations in clinical research. Chapman and Hall/CRC. (pp. 13-15, 77)
Stuart, A., Ord, K. & Arnold, S. (2004). Kendall's advanced theory of statistics, classical inference, and the linear model. John Wiley & Sons. (pp. 190-191)
Casella, G., & Berger, R. (2002). Statistical inference (2ed). Chapman and Hall/CRC. (p. 385)
Davison, A. C. (2003). Statistical models. Cambridge University Press. (p. 334)
Cox, D. R., & Hinkley, D. V. (1979). Theoretical statistics. CRC Press. (pp. 103-104)
Belle, G. van. (2011). Statistical Rules of Thumb. John Wiley & Sons.
Wu, J., & Ding, P. (2021). Randomization tests for weak null hypotheses in randomized experiments. Journal of the American Statistical Association, 116(536), 1898-1913.
Ding, P. (2024). A first course in causal inference. Chapman and Hall/CRC. pp.25-55
Imbens, G. W., & Rubin, D. B. (2015). Causal inference in statistics, social, and biomedical sciences. Cambridge university press. pp.83-112


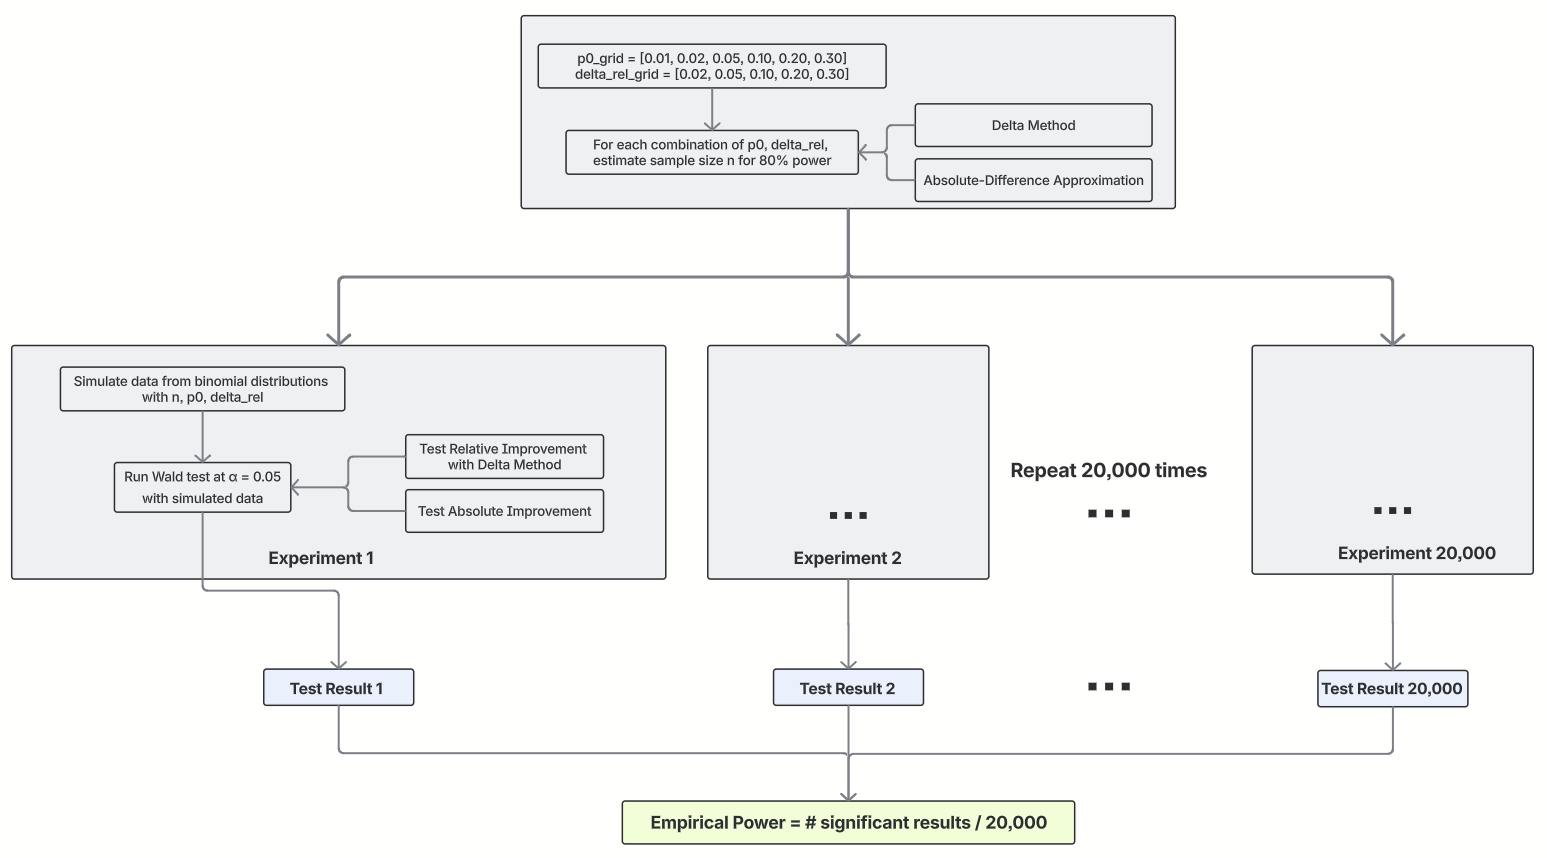 Simulation results testing absolute mean difference
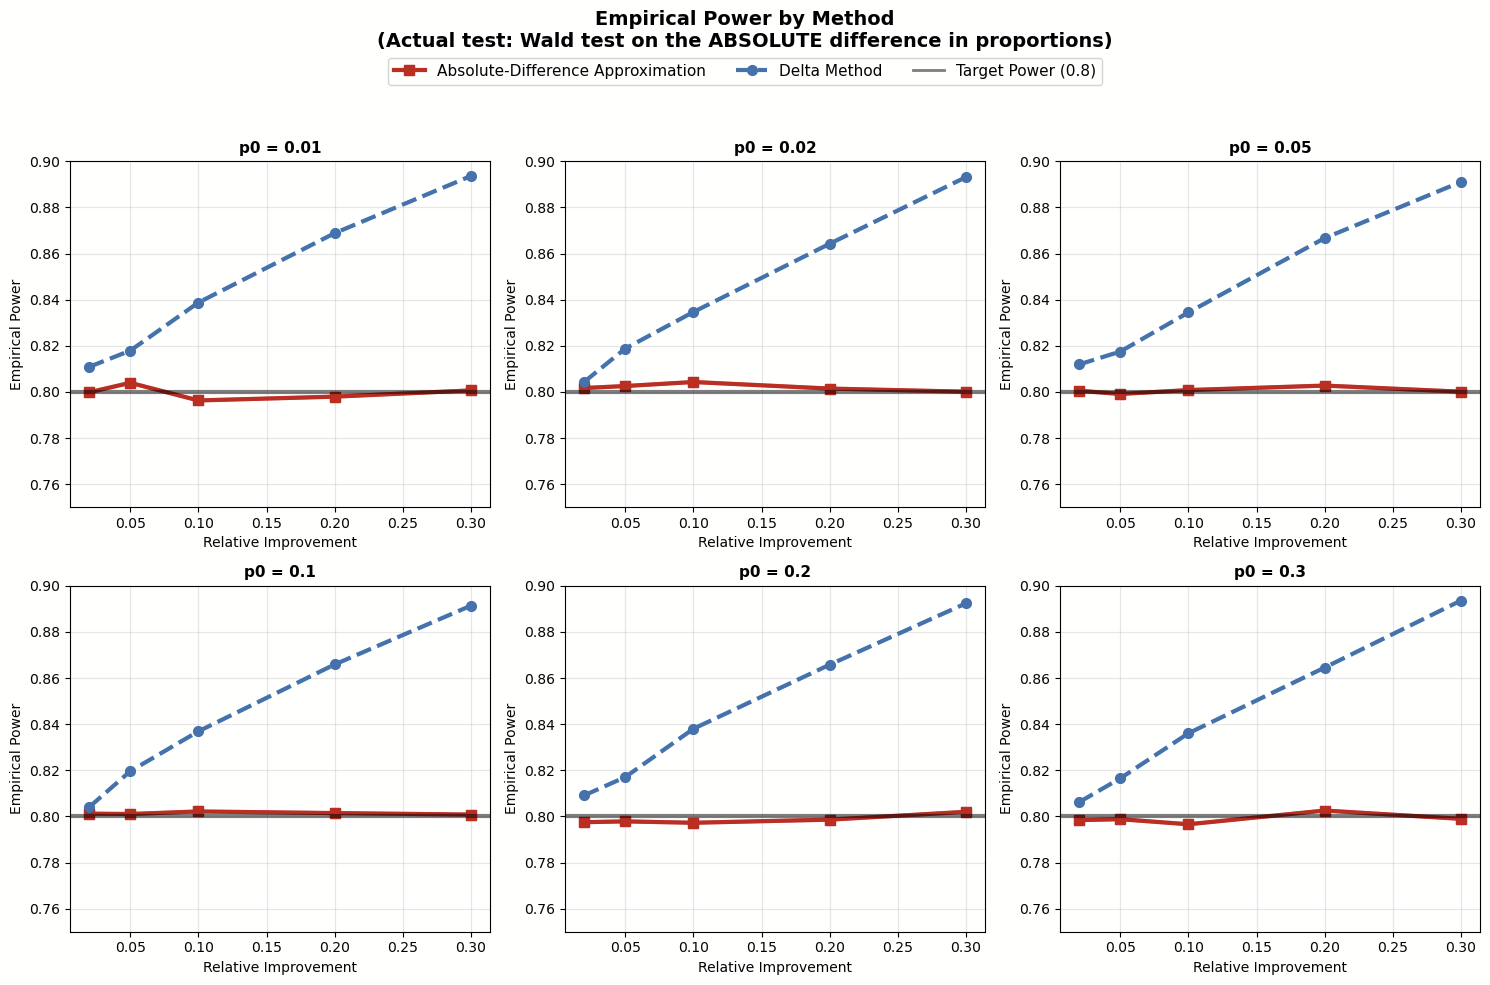 Simulation results testing relative mean difference