graphical user interface, application

Building a culture of experimentation has the potential to simplify your customer experiences and increase conversions... 

However, it can also hurt you if you can’t reach statistically significant results. 
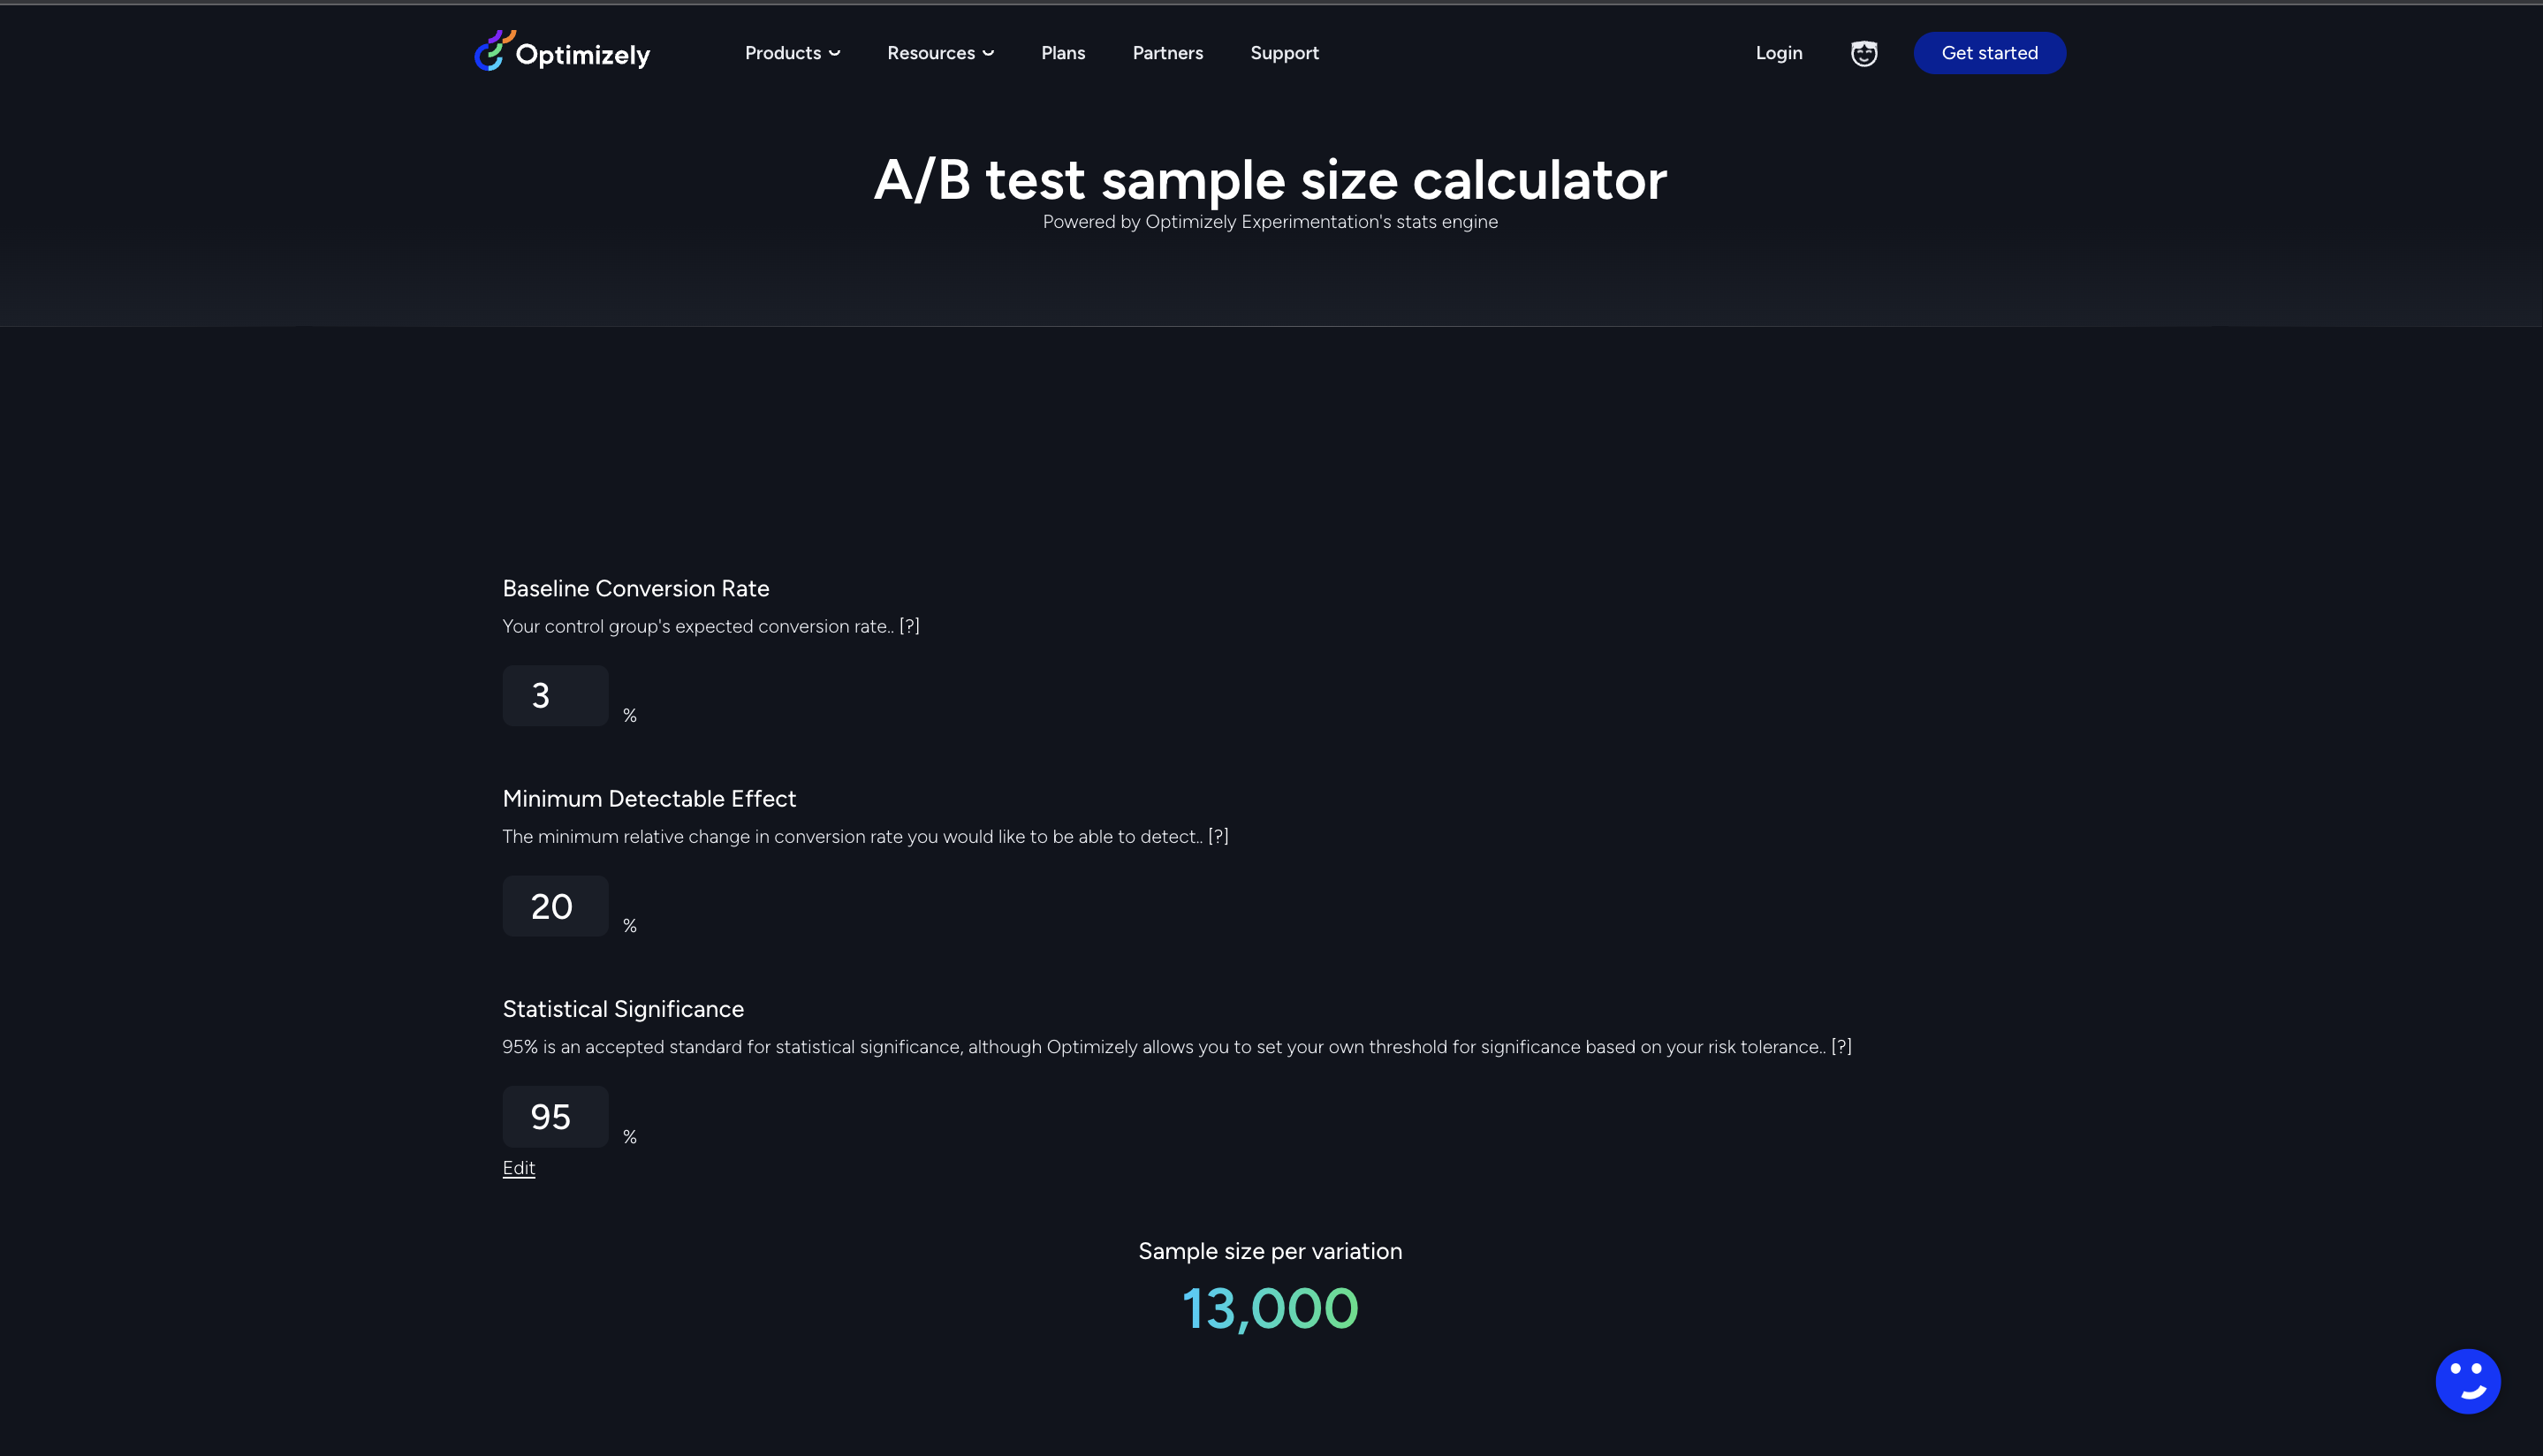
For instance, you need an adequate sample size to run a test. Next, it is time to run these tests for a period long enough to get statistically significant results. 

As you’re running experiments and a/b tests, it’s better to stop a test only when your variations reach significance. If some of the variations have not reached significance, decide if you want to wait for the number of visitors to increase or a larger sample size.   

A faster way to do this is to use our A/B test sample size calculator and the Stats Engine. 

In this article, see how to estimate experiment length in advance, measure results through data and calculate how much traffic you’ll need for your conversion rate experiments. 

Required sample size and time frame for A/B testing 

To have a clear winner between different variations you have in a test group, you need to test enough with a minimum sample size or the number of people. Once you have the results, check if there is a statistically significant difference instead of a null hypothesis. For example, if you want to test headline copy on a landing page, it can take a few weeks to show results. Think of a similar timeframe for your blog engine. 

It all depends on your company, sample size, what tool you use to conduct A/B tests and more. If you have a small list, you'll need to A/B test most of it to reach a significance level. 

How to calculate sample size 

If you’re wondering how to calculate sample size, the best way is to use metrics such as baseline conversion rate (it is your control group's expected conversion rate) and minimum detectable effect (mde) to help with sample sizes for your original and variation, so you meet statistical goals.   

The values you input for the ab test sample size calculator will be unique to each experiment and goal. With time, more visitors will arrive, encounter your variations and convert. Now you will start to see Statistical Significance increase and receive an accurate estimate of test duration. 

Here are two calculations to help you translate sample size into the estimated number of days you'll require to run an experiment: 

#Calculation 1 

Total number of visitors you need = Sample size × Number of variations in your experiment 

#Calculation 2 

Estimated number of days to run experiment = Total number of visitors you need ÷ Average number of visitors per day 

The outcome you want isn’t far away. Optimizely's sample size calculator offers accurate results in seconds. Use it and it’ll show your sample size.Here's what it looks like: 

optisamplecalculatorhomepage

The best part? 

There is no necessity for solely relying on sample size calculation to show the validity of your results. Use it for the planning phase. For the rest, we have the Stats Engine. 

What is Stats Engine? 

If you’re wondering what makes a good test, then speculation is not the answer. Go on a hunch through false positives and your error rate can skyrocket over 30%.  

Speed and scale impact your digital experiences if they are data-driven and based on the accuracy of results. This is where a stats engine can help you. You can remove guessing problems by taking a sequential testing approach.  

It measures the standard deviation in your process and helps you drive impactful change to your business, guided by data, so you can make faster decisions for building a culture of experimentation. Here're other benefits: 

You can monitor results in real-time to make data-driven decisions quickly without sacrificing the integrity of data. 

The statistical power of a sequential test naturally increases as the test continues to run, eliminating the need for hypothesis testing and arbitrary guesses about your effect sizes. 

You can adapt to the true effect size automatically and stop early for larger-than-expected effect sizes, enabling faster times to significance on average. 

You can clearly see the statistical likelihood that the improvement is due to changes you made, not a chance. So, choosing the right significance level matters as it increases confidence in your a/b testing methods. The confidence interval on improvement has to move away from zero to allow an experiment to reach a state of significance. 

You can check out the full whitepaper here to see how experimentation runs on a stats engine. 

Finally... 

It is not easy to keep an eye on your experiments and whether they have adequate data to reach a conclusive result. This massive problem can be fixed with Optimizely. 

Our stats engine achieves a power of one, so your test results will always have data to show. Use it to quickly change your digital marketing plans and focus on Conversion Rate Optimization (CRO). 

If you want a better understanding of your AB tests and deliver modern e-commerce experiences, check out this big book of experimentation. It's like an ab test guide and has real stories of organizations that benefitted from building a culture of experimentation. 

And get started here to ensure the validity of your results and make decisions faster.


About the author