Top 10 takeaways on how to scale an experimentation program

You already run tests. Now you're drowning in them. This guide shows you how the best programs scale from 'a few A/B tests' to an experimentation machine, without the chaos.

Most programs don't scale. They just get bigger. 

The instinct when things are working is to go faster. More tests. More teams. More surface area. Volume looks like progress because activity grows.

But nobody on the velocity treadmill wants to admit that volume without structure produces noise, not signal. Scaling isn't doing more. It's building the conditions where doing more actually pays off.

Here are the 10 takeaways from the experimentation playbook on how to scale your experimentation program 👇

1. Volume without structure dilutes

Hypothesis quality slips when there's no benchmark to hold teams to. Results stop influencing decisions when no one owns the follow-through. Stakeholders lose faith when the program can't explain its impact in terms that anyone outside the team cares about.

Most programs that struggle to scale hit the same wall. Tests run, but nothing changes. Teams start testing outside the program because the central process feels too slow. The program lead becomes the bottleneck on their own program.

None of this means the program is broken. It means it was built for a smaller scale than it's now trying to operate at. 

2. Growth comes from three directions, not one

Once a program is delivering results, there are three places to scale. 

1

Depth: Increasing test volume within your existing area. Most teams aren't fully using the traffic and surfaces they already have. More concurrent experiments, more variations per test, shorter gaps between tests. 

2

Breadth: Wider coverage across the customer journey. Many programs live on a handful of high-traffic pages and call it done. Real scale means moving into acquisition, onboarding, feature adoption, and retention. 

3

Other teams: Marketing, product, and customer operations all make decisions that testing can improve. The program's job is to bring those teams in under a shared framework, so experimentation stops being something one team does and starts being how the organization thinks. 


3. The analyst is the role most programs underinvest in
 

As programs scale, one specialist role consistently proves its worth and is consistently shortchanged. The analyst.

Analysis at scale isn't reporting. It's interpretation. An analyst who can segment results by audience, identify why a test won or lost, and turn findings into the next set of hypotheses is worth more to a scaled program than any dashboard.

The hidden cost most programs don't see coming is the operational work. The more tests you run, the more analyst time the program consumes. Pulling metrics, reconciling experiment data with business data that lives in different systems, and aligning sources.

As velocity grows, analyst capacity quietly becomes the ceiling on how fast the program can actually move.

Programs that pipe experiment results directly into the metrics already in their data warehouse, rather than maintaining a separate analytics layer, cut analysis time per experiment significantly.

4. Most programs don't choose a governance model. They inherit one.

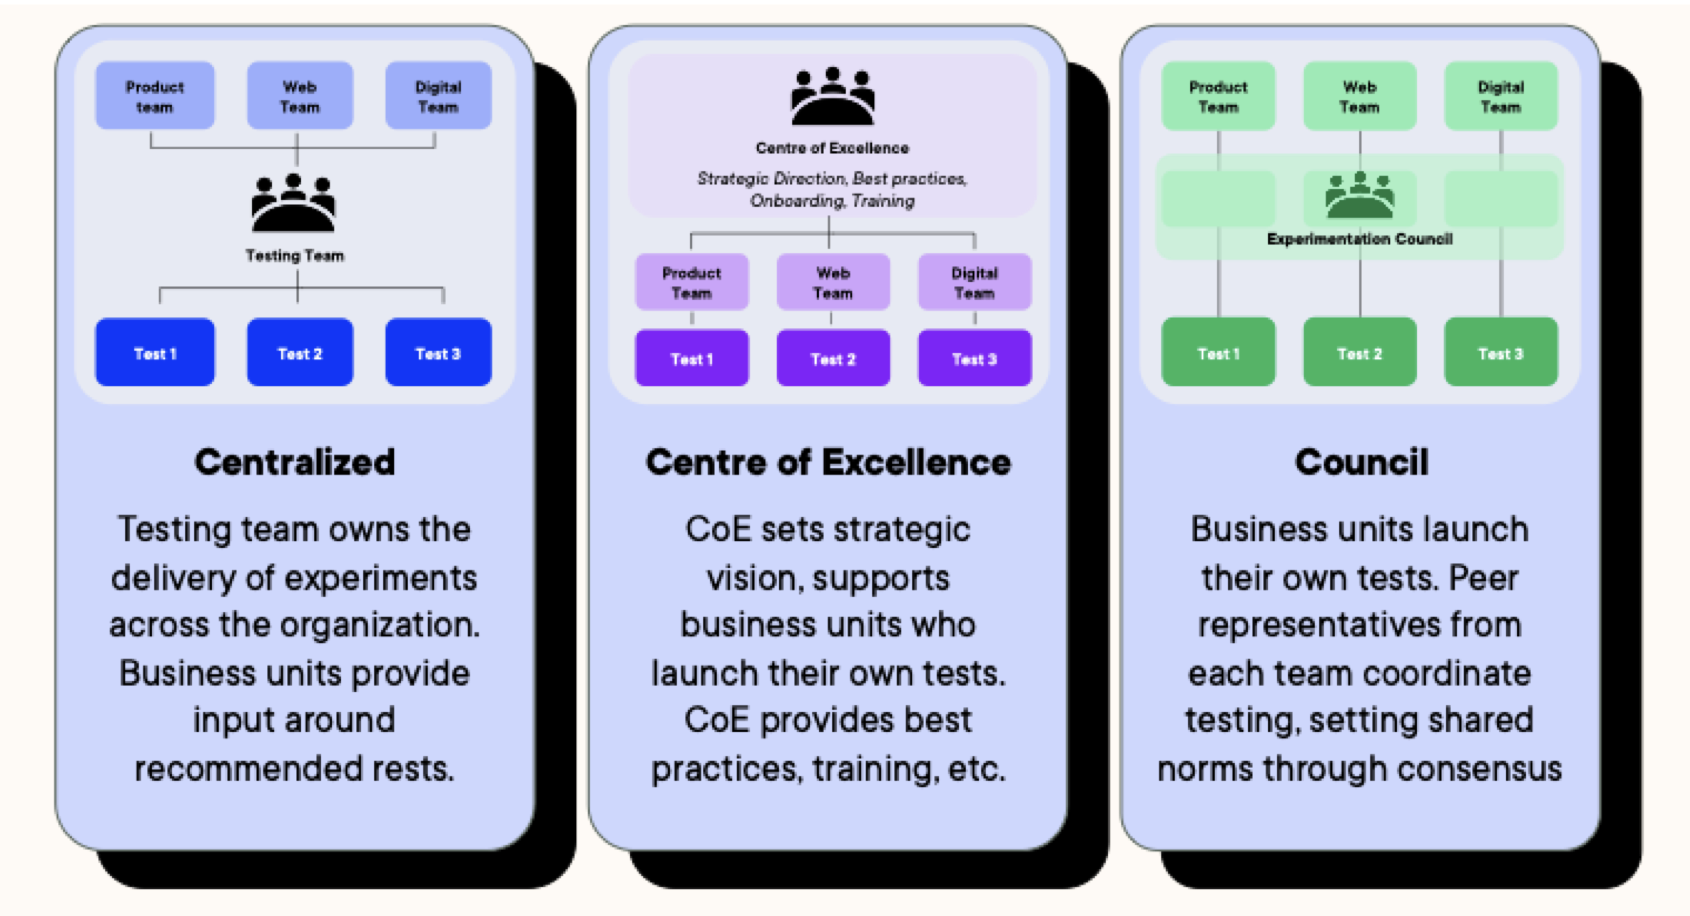
The first program lead owns everything by default. That's centralized governance, whether anyone designed it that way or not. Understanding how programs typically evolve lets you move deliberately instead of reactively.

Know these three models: 

1

Centralized: One team owns strategy, standards, and execution. Other teams submit requests, and the central team runs the tests. High control, high consistency. Testing is capped by the central team's capacity. 

2

Center of Excellence: A central function owns the standards, tooling, training, and measurement frameworks. Teams run their own tests within those guardrails. The model balances consistency with speed at scale.

3

Council: Representatives from each team meet regularly to share results, flag overlap, and develop shared practices. Good for coordination and learning across largely independent teams. Standards are only as strong as the group's willingness to hold each other to them. 

Governance modelsImage source: Optimizely

5. Experimentation culture only works when it enables 

The Culture of Experimentation (COE) is what scaled, high-performing experimentation programs converge on. It doesn't own all the work. It owns the conditions that make work across the organization consistently good. 

The model breaks the same way every time. The culture of experimentation gets so focused on maintaining standards that it slows teams down instead of enabling them. Teams start routing around the program. Fewer submissions. Informal tests outside the platform. Experimentation quietly dropped from roadmaps.

The check that matters is whether you're making it easier for teams to run good experiments, or harder.

Four anti-patterns to watch for: 

  • The approval cascade: Every test needs sign-off from five people before it can launch. Match the level of review to the level of risk. 
  • Standards without support: A detailed standards document that nobody follows because nobody was trained on it, and nobody's enforcing it. 
  • Governance that only goes upwards: Results reach the program team but never travel sideways to the teams who could actually use them. 
  • Governance overreach: The COE adds checks faster than it adds enablement, and teams start avoiding the process. 

6. Experimentation isn't just a validation tool 

Most teams use experimentation as a validation tool. You built something. You think it's better than what it's replacing. You run a test to confirm before you ship. 

It's a conservative use which leaves most of the value on the table.

Experimentation is a capability that makes every stage of product development smarter, faster, and lower risk.

Five archetypes map to the product lifecycle. 

1

Blue Sky Research

These experiments answer strategic questions that sit upstream of any specific feature or roadmap item. The purpose isn't to validate something you've already built or planned. It's to understand user behavior, test strategic assumptions, or quantify the impact of a direction before you commit to it. In short, these experiments inform the roadmap rather than validate something already on it.

Example: A streaming platform wanted to understand the trade-off between collecting demographic data at sign-up and the drop in sign-up conversion that extra friction would cause. Rather than guessing, they ran an experiment to measure both sides, giving them the evidence to make a financially grounded decision.

2

Discovery and validation

These experiments test whether genuine user demand exists for a feature before significant development resources are committed. The painted door test is the classic example: show users an option to use a feature that doesn't exist yet. Measure whether they'd engage with it if it did.

Example: A media publisher considering a 'save for later' feature ran a painted door test before committing to the build. The result showed exactly how many users wanted it and how often they'd use it, giving the product team the evidence to make a confident prioritization call.

3

Solution design

These experiments run during active development, when the team knows what they're building but hasn't decided the best way to build it. Instead of designing in a room and shipping a single version, the team tests multiple approaches to find the most effective one before full rollout.

Example: A financial services company redesigning a high-abandonment application form tested changes iteratively: reducing unnecessary fields, adjusting field order, improving mobile responsiveness. The iterative approach identified exactly which changes drove improvement, resulting in a significant reduction in abandonment.

4

Derisk deployments

These experiments manage launch risk through controlled rollouts rather than binary ship-or-don't decisions. Feature flags let teams deploy code to production and release it to users gradually: 10%, then 25%, then 50%, then 100%, monitoring at each stage to confirm the release is performing as expected.

Example: A broadcaster rolling out a picture-in-picture viewing feature was concerned about the impact on advertising impressions. Rather than releasing fully and reviewing retrospectively, they used a feature flag to roll out gradually and tracked exactly when users minimized the screen. The data removed any concerns and gave the team confidence to proceed.

5

Optimization

These experiments run on live features to improve performance over time. Structured A/B tests against clear metrics, iterating toward better performance once a feature is stable and live.

Example: A ticketing platform testing a dynamic pricing model produced a measurable increase in overall revenue, improved seat occupancy, and a reduction in last-minute discounting. None of that would have been knowable without running the test.

The most sophisticated programs don't treat experimentation as a stage-specific activity. They create continuous loops. Each test makes the next one smarter. 

7. An idea is not a test-ready hypothesis

There's a clear difference between an idea and a test-ready hypothesis. 

An idea is: "make checkout faster." 

A test-ready hypothesis is: "If we reduce checkout from four steps to two, we'll increase purchase completion rate for mobile users, because session recordings show 40% of mobile abandonment happens at step three."

A test-ready hypothesis answers four questions: 

What are we changing, and for whom?  

What outcome do we expect, and why?  

How will we measure success?  

What are the guardrail metrics we're making sure we don't accidentally damage? 

The "because" clause is the most important part. It forces the team to articulate the assumption being tested. That assumption is what the program learns, whether the test wins or loses. A hypothesis without a "because" is an instruction, not a scientific question.

The single most impactful thing an experimentation program can do is establish and maintain a clear standard for what a good hypothesis looks like. Without it, test quality varies by team, by individual, and by how much time someone had that week.

8. Every team needs a different conversation

Every team will ask the same question in different ways. What does this do for us? Bringing them in requires a different conversation each time. 

Product teams need experimentation built into the sprint cycle. Hypothesis writing as part of story definition, not a separate workstream. Developer capacity that's planned in, not negotiated every time. Metrics tied to product OKRs, not generic conversion rates.

Content and campaign marketing teams need a lightweight intake process. They can't use the same heavyweight brief format as a product experiment. Metrics that reflect what they care about: engagement rate, time on page, email open and click rates. Results in plain language. Message performance, not p-values.

Customer service and operations teams need analytical support upfront to design the right measurement approach. Self-serve metrics aren't enough for this work. Operational tests are different from web tests and shouldn't be squeezed into the same template.

Data science teams sit at the edge of the program's orbit. They need access to the stats engine for warehouse-level analysis, not just platform-run experiments. A governance model that respects how they work, not a one-size-fits-all approach.

9. How a program responds to losing tests tells you everything

If your program is producing wins at a significantly higher rate than the 12% industry average, one of three things is true. You're running unusually good tests. You're only running safe tests. Or you're calling tests incorrectly. The third is most common. 

A healthy win rate is 10 to 30%. A healthy conclusive rate, wins and losses combined, is 35 to 40%.

The clearest indicator of a genuine testing culture is how the organization responds to negative results. In cultures where testing is valued, a negative result is information. It saves you from shipping something that would have made things worse. It's worth exactly the same as a positive result.

In programs where testing is performative, negative results are problematic. They create pressure to reframe the metric, find a different audience, or run the test again until it produces a win. 

10. Measure individual experiments and the program itself 

Measuring program impact is different from measuring experiment results.

An individual test tells you whether a specific change improved a specific metric. Program measurement tells you whether the program itself is delivering value. 

Two approaches: 
1

Bottoms-up  

It quantifies the dollar impact of each experiment and aggregates those impacts. For each test, baseline conversions are multiplied by the value per conversion, the winning uplift, and an adjustment factor that accounts for aggregation effects. Optimizely commonly applies 50% as a starting point, calibrated to the program over time.

Bottoms-up gives strong insight into individual experiment returns and directional insight at the program level. 

2

Top-down  

It measures the program's overall impact by comparing users exposed to the experiment against a persistent holdout group. Typically, 5 to 10% of traffic is reserved as a global holdout that continues to experience the baseline. The difference in performance, applied to total traffic, is the realized impact. 

Top-down captures the true realized impact of the program. It's more accurate than bottoms-up for total program impact, but less diagnostic. You can see that the program is driving value, but you can't attribute it to specific experiments.

Leading organizations use both. Bottoms-up for experiment-level insight. Top-down for program-level validation. 

Where to go from here

Scaling a program is a direction. There's no version where you finish building your governance model and move on. The program is a living system that evolves as test volume grows, as new teams join, and as the people running it develop their skills. 

Three commitments worth holding to: 

1

Build the structure before chasing the volume: Standards, roles, and shared infrastructure produce more learning per test. Without them, more tests mean more noise. 

2

Choose your governance model deliberately: Most programs inherit one. The COE is where scaled programs converge, but only when it enables rather than polices. 

3

Measure the program two ways: Bottoms-up to learn what worked. Top-down to prove the program is working. 


You'll know you're getting there not because of the velocity numbers, but because of the way decisions get made
. Becausethe experimentation lead gets invited into strategic conversations rather than briefed after them. Because leadership references test results when talking about what's working.

And because "how would we know if that's true?" becomes a reflex, not a challenge. 

Full playbook

The takeaways above are the short version. The full report covers the six-stage lifecycle in detail, the prioritization and metric frameworks in practice, the analysis discipline that turns results into decisions, and the operating cadence behind all of it.