Koble deg direkte til datavarehuset ditt for pålitelige innsikter som beviser din påvirkning og setter en stopper for alle debattene.

Product managers
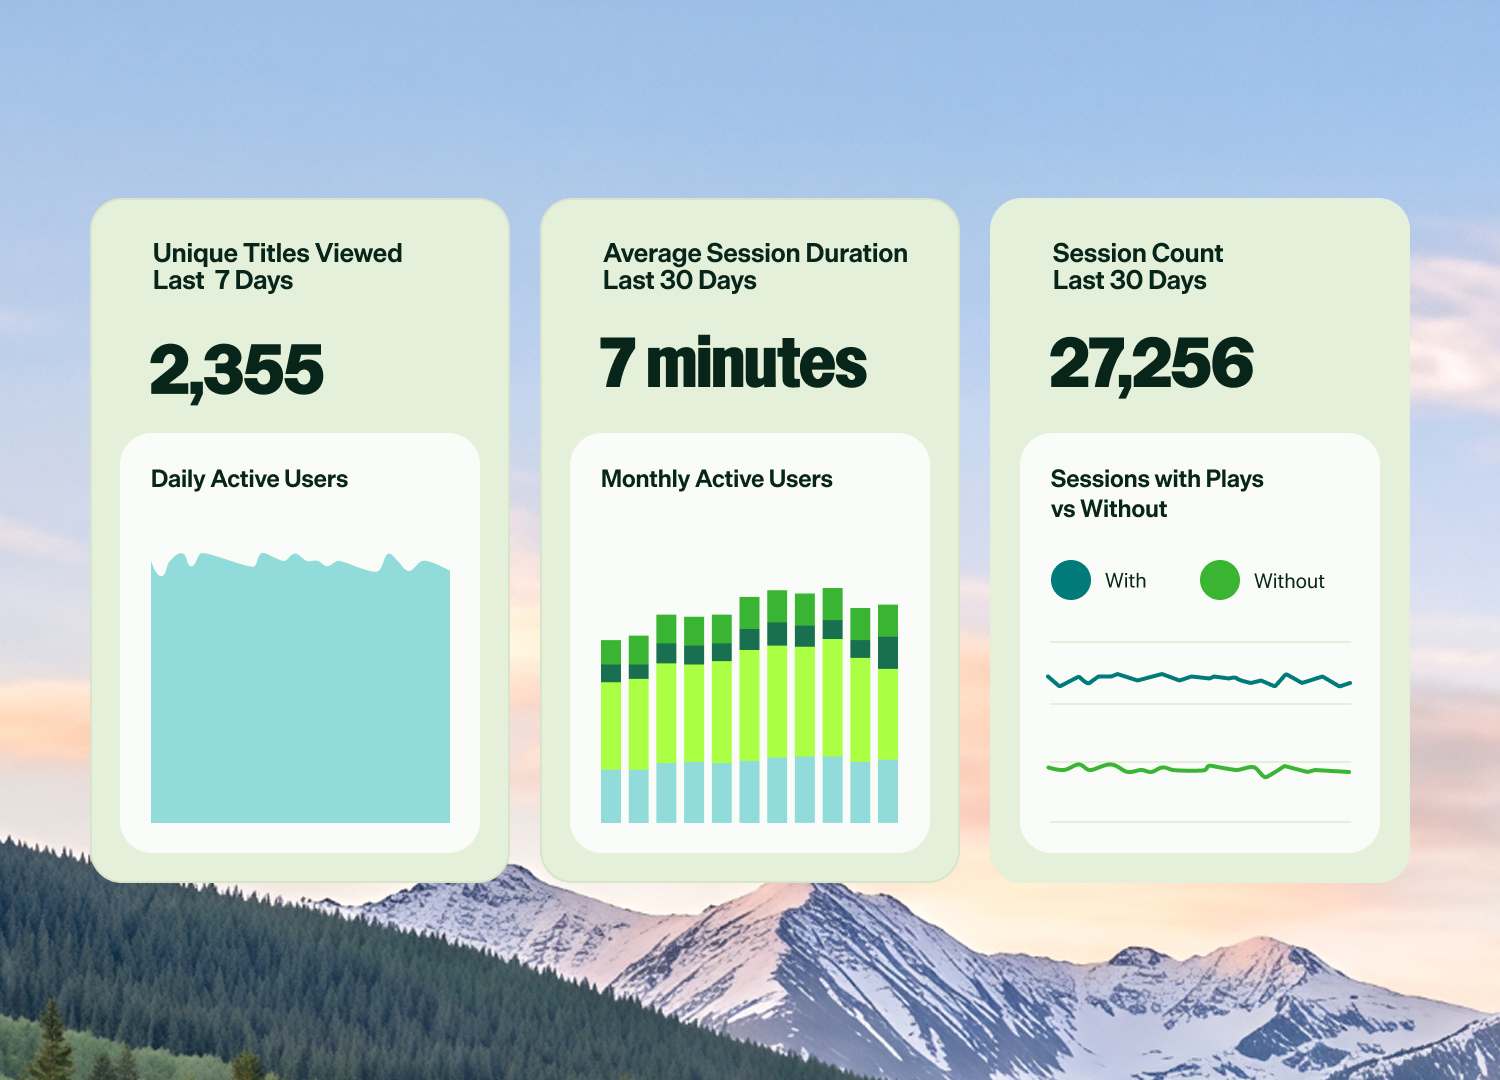
Instantly measure feature adoption, retention, and the impact of new releases.
Koble deg direkte til datavarehuset ditt for pålitelige innsikter som beviser din påvirkning og setter en stopper for alle debattene.
Betrodd av over 10 000 merkevarer
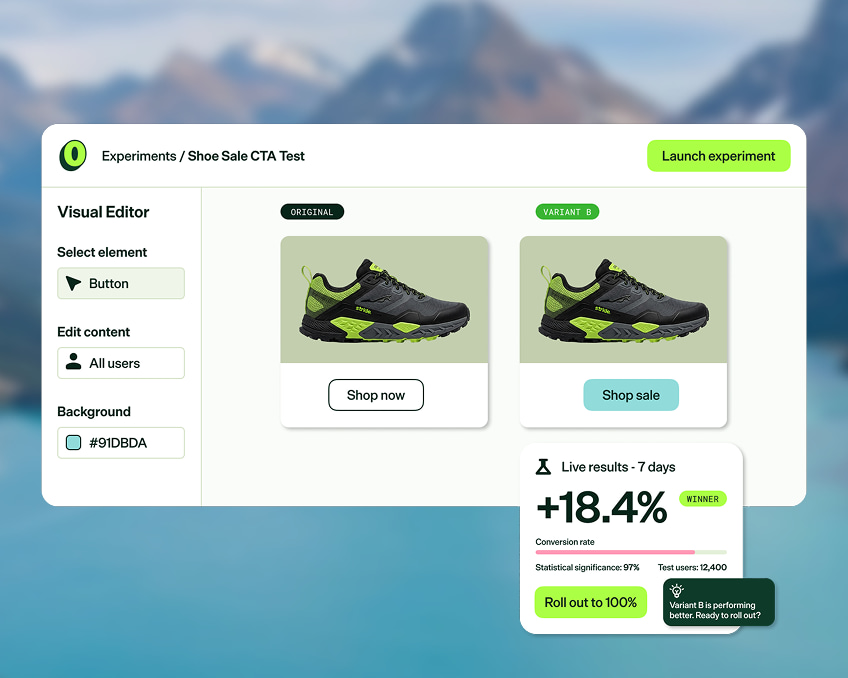
Stats Engine-drevne A/B-tester og feature flags gir deg resultater du kan stole på, med agenter som avdekker hva som gir resultater slik at du ikke trenger å grave gjennom dashboards for å finne det.
Koblet for forretningsmessig effekt
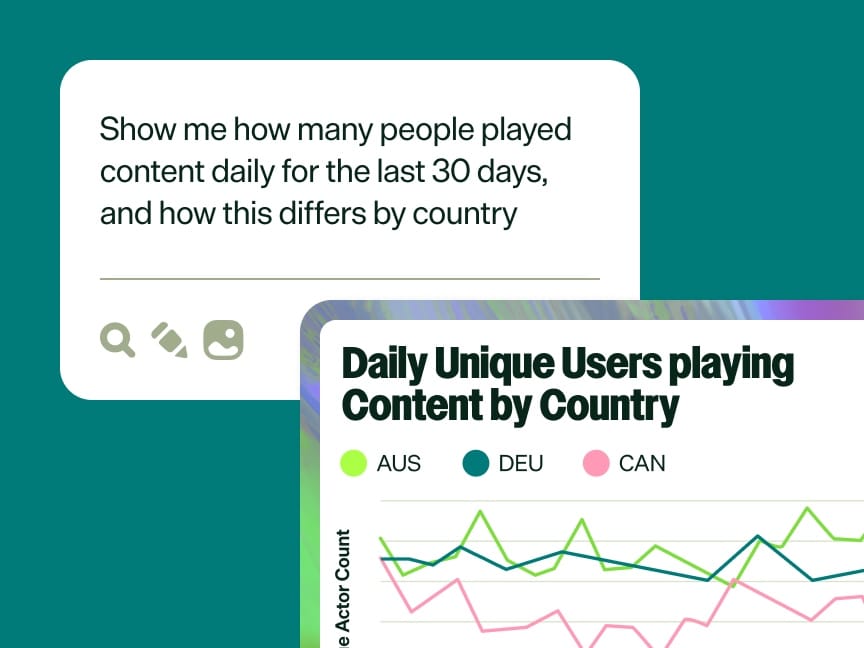
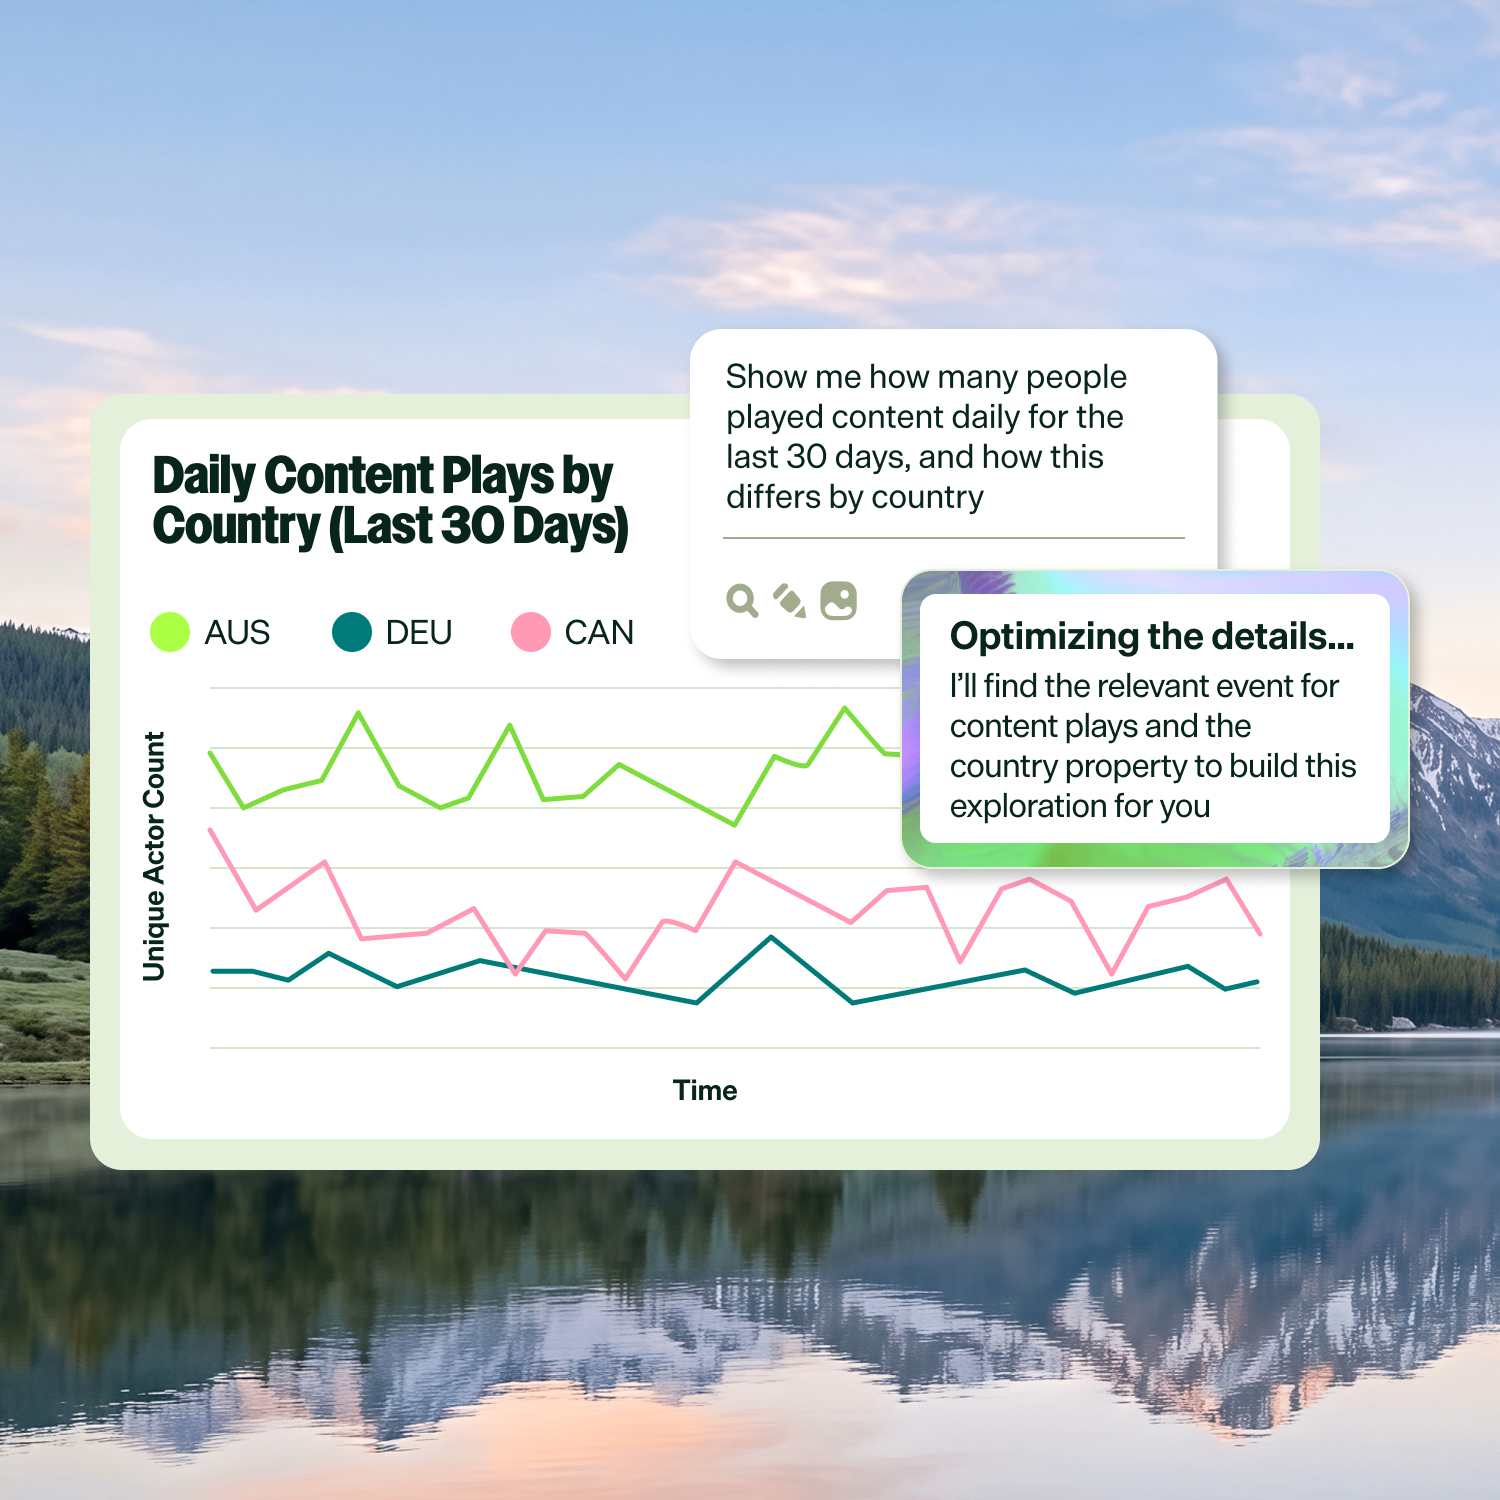
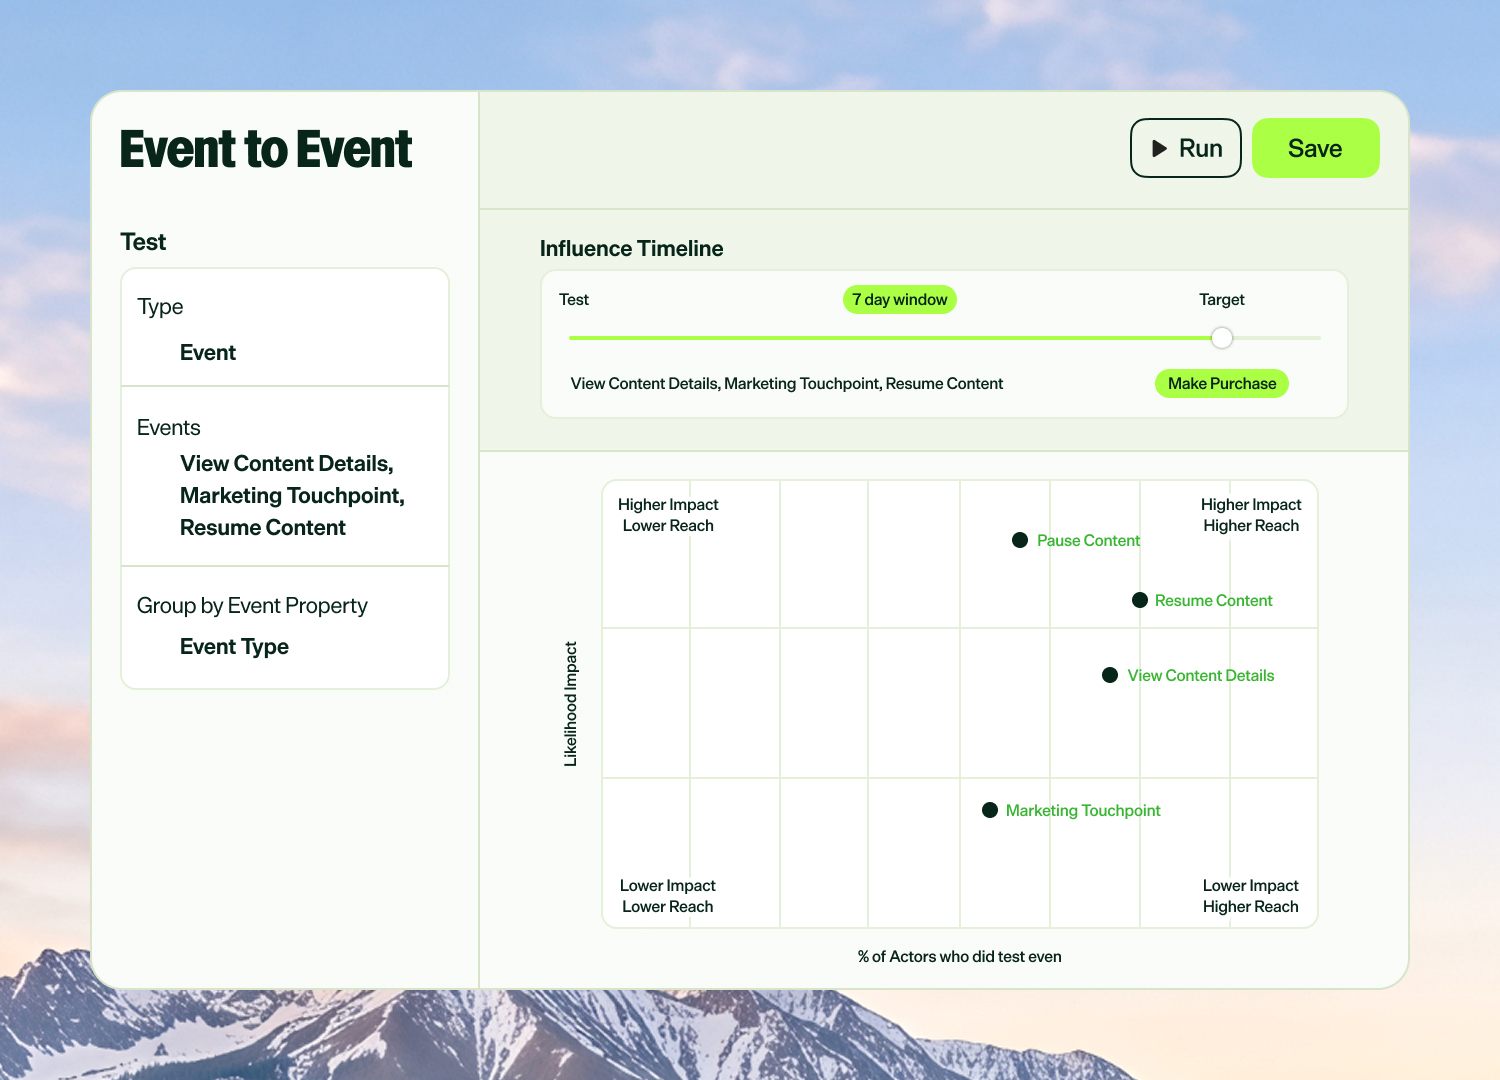
Se nøyaktig hvor brukere faller av, hvilke reiser som konverterer, og hvilke segmenter som er verdt oppmerksomheten din. Ingen SQL, inget datalag, ingen ventetid.
Ikke vent på utviklere
Noe brekker i produksjon? Deaktiver flagget fra dashboardet. Ingen re-deploy. Ingen hendelse klokken 2 om natten. Funksjoner slås av på sekunder, ikke timer.
Metrikker bygget rundt virksomheten din
Definer hvilken som helst metrikk virksomheten din trenger, fra enkle tellinger til komplekse modeller, og la agenter varsle når noe endrer seg før du trenger å spørre.
Instantly measure feature adoption, retention, and the impact of new releases.

End ad-hoc requests and empower business teams with self-serve analytics, so you can focus on strategy.

Prove your ROI by connecting campaigns to revenue and LTV across the full customer journey.
Optimizely Analytics kobler datavarehuset, eksperimentene og kundedataene dine til én enkelt kilde til sannhet. Slik at teamet ditt kan handle raskere på det som faktisk betyr noe.
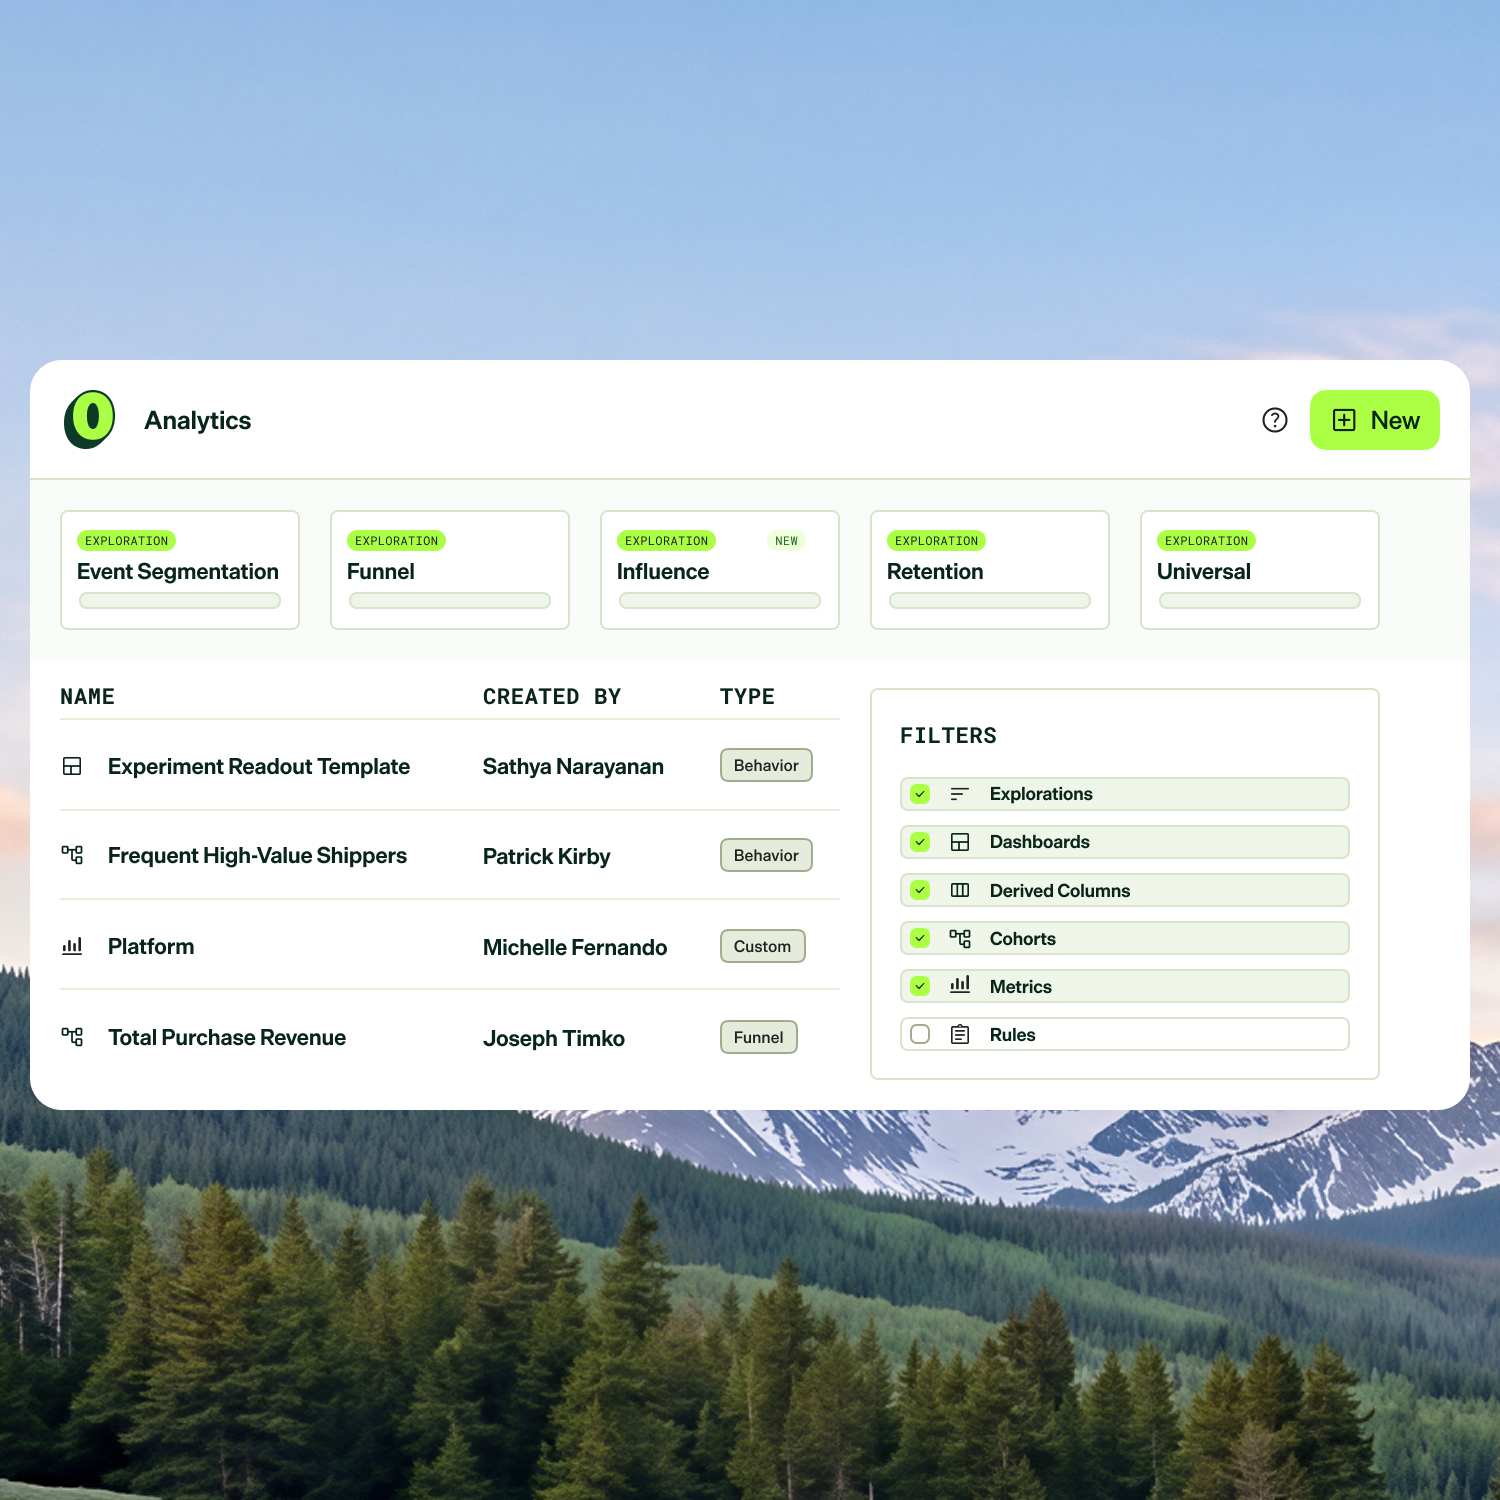
Analytics kobler seg direkte til skydatavarehuset ditt for raskere svar, mindre duplisering og ingen inkonsistenser som bremser teamene.
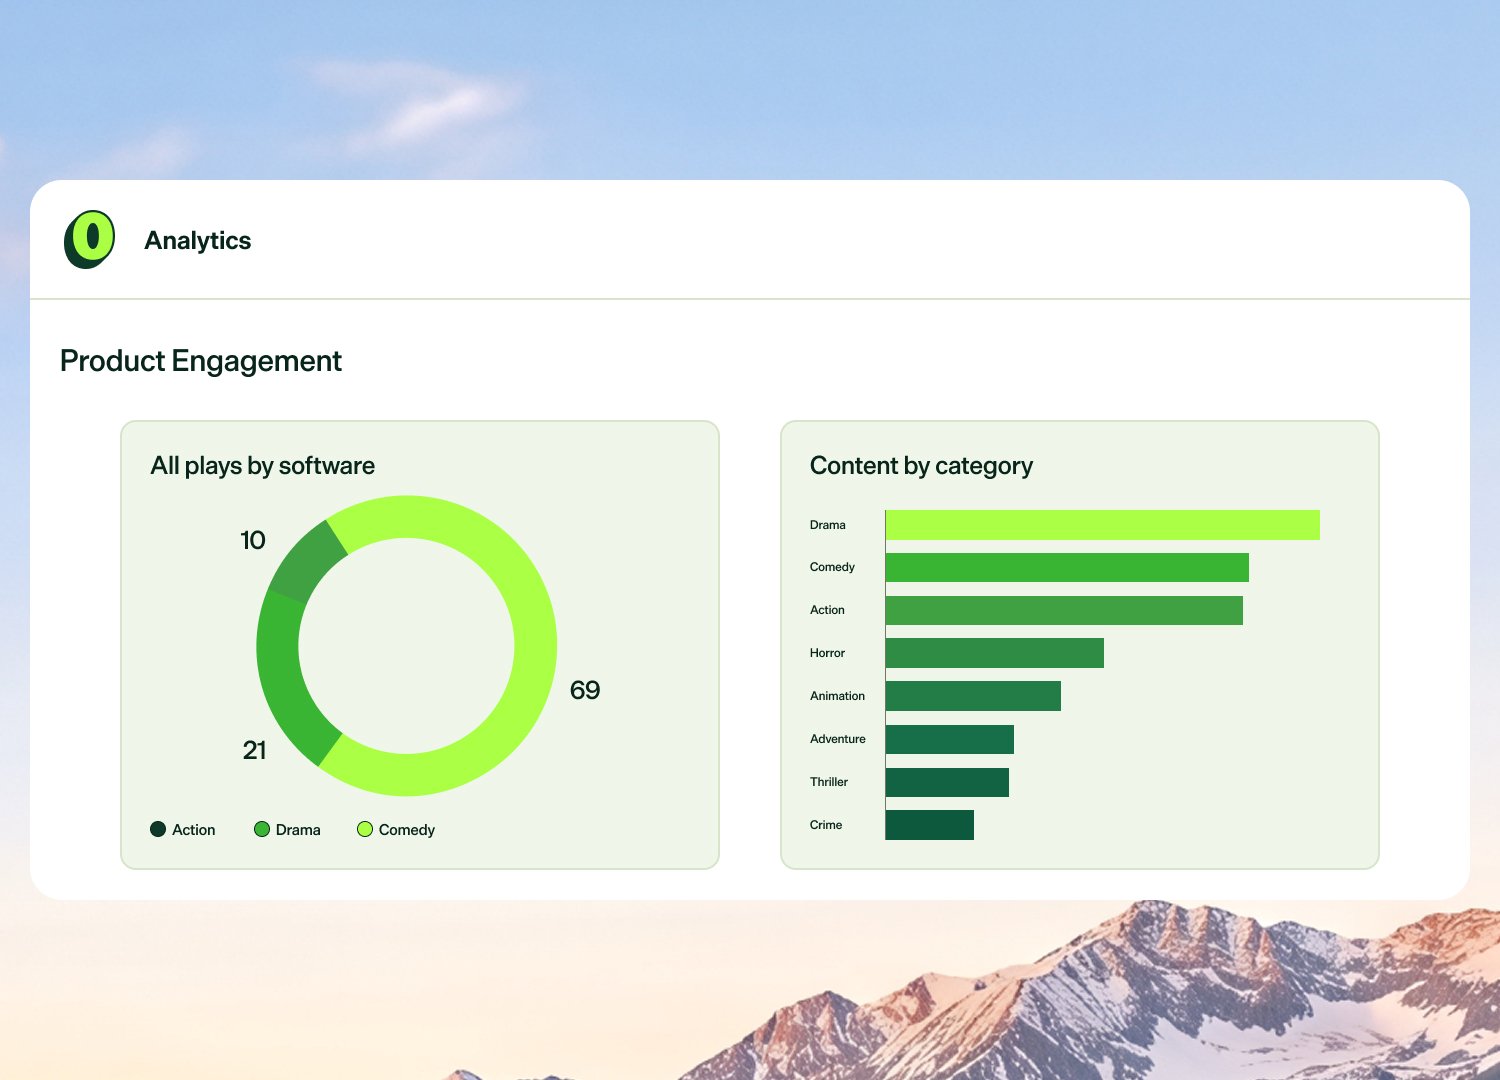
Bygg modeller, dashboards og visualiseringer uten SQL eller avhengigheter til datateamet. Beslutninger tas raskere og rapporteringskøen krymper.
Analytics kobler seg direkte til skydatavarehuset ditt for raskere svar, mindre duplisering og ingen inkonsistenser som bremser teamene.
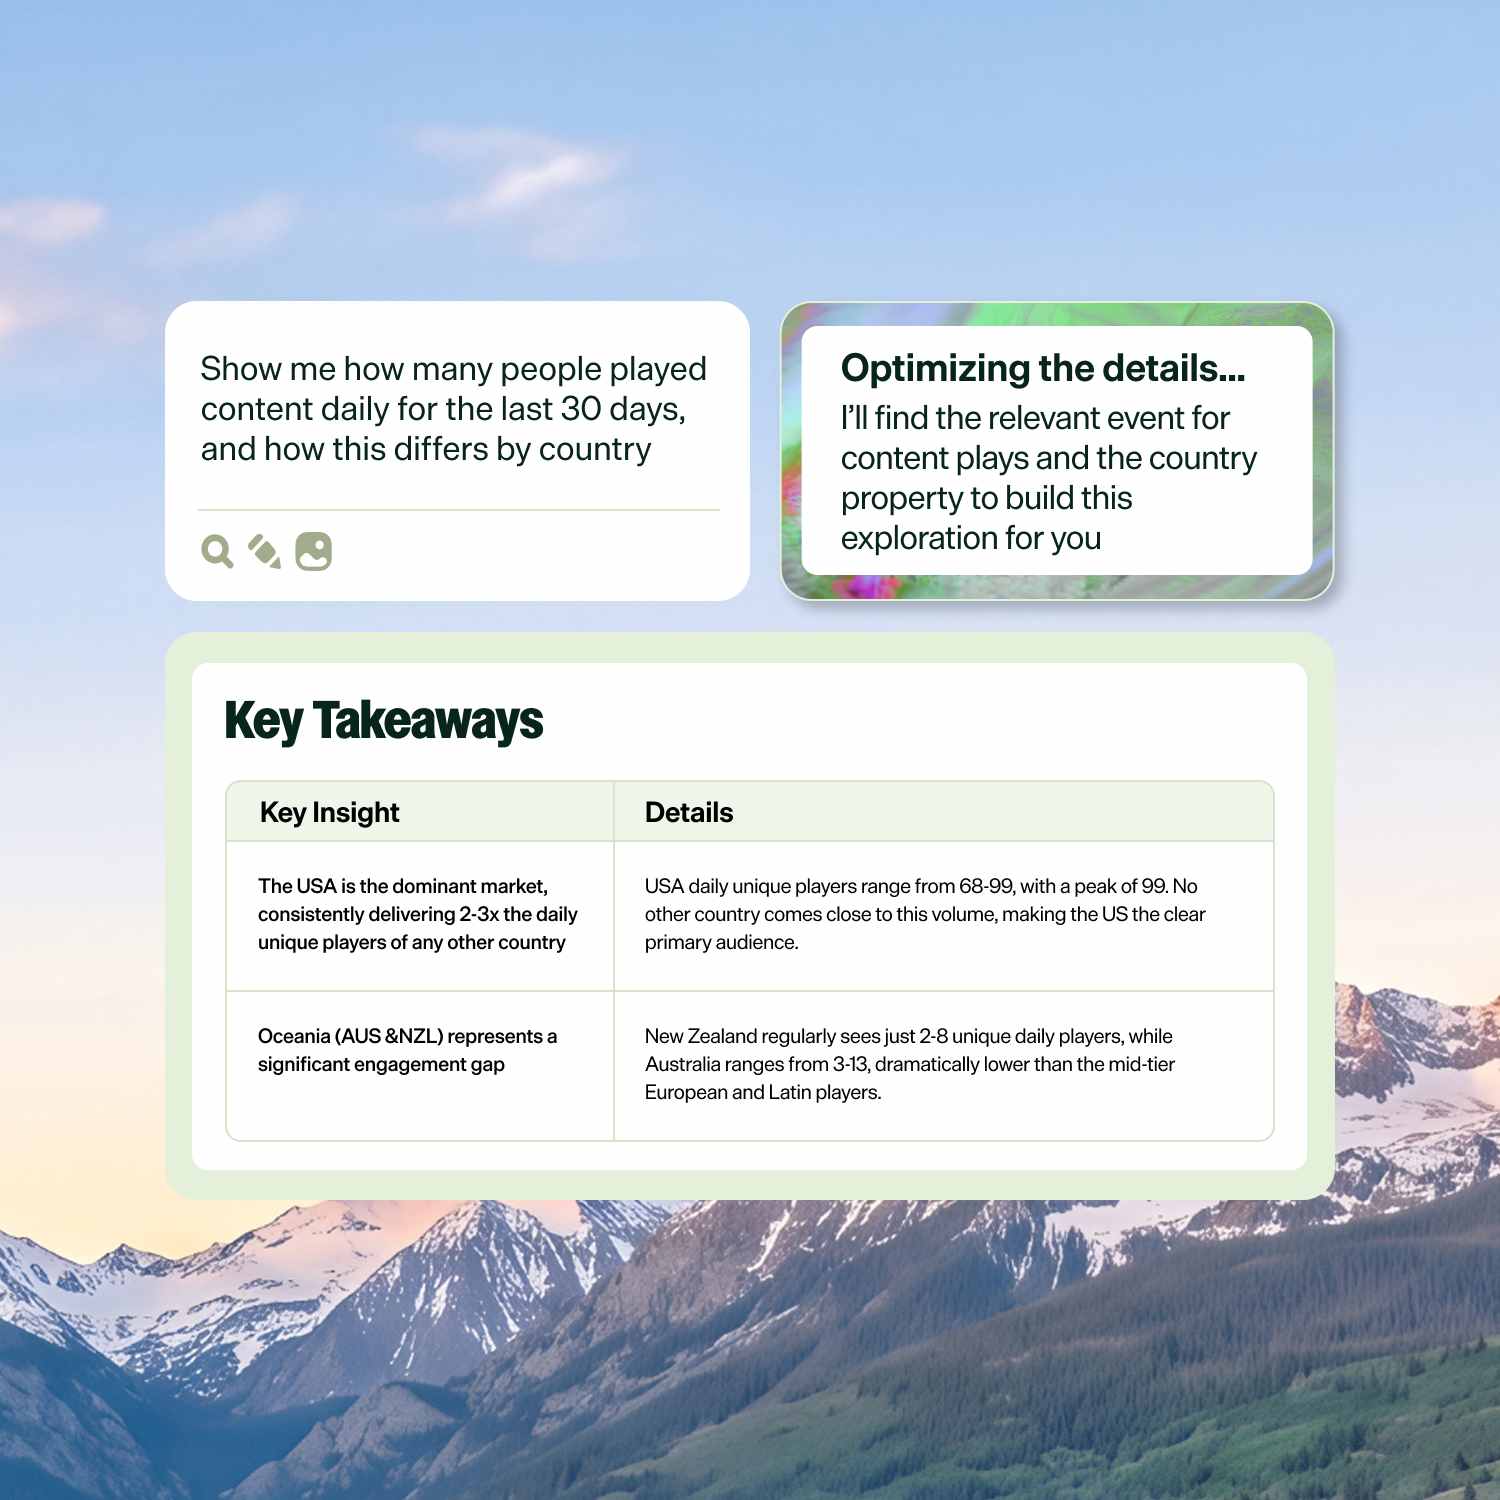
Data Sniper

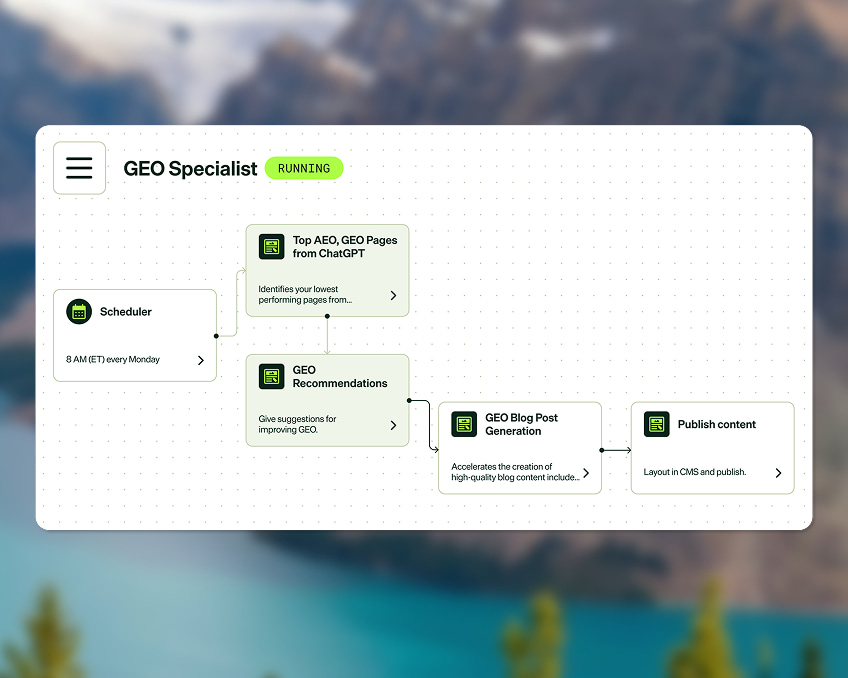
Vi har et helt bibliotek av forhåndsbygde KI-agenter som kan hjelpe deg med analyse. Bruk dem som de er, eller lag din egen agent tilpasset teamets innholdsbehov.
Utforsk alle agenter
Kom i gang på timer med forhåndsbygde, sikre koblinger til ledende datavarehus.


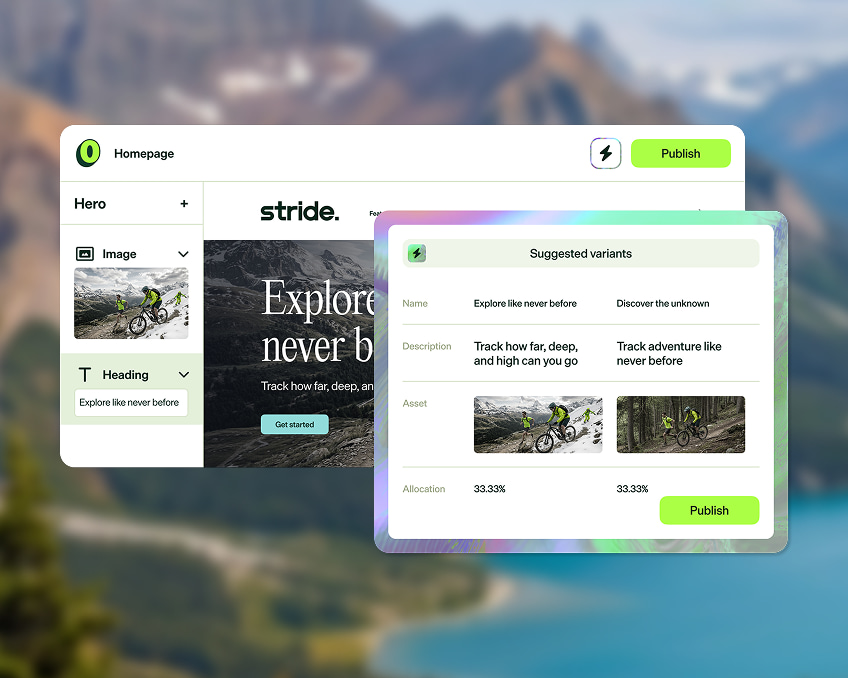
Bring funksjonene dine til live med verktøy for innholdsproduksjon, optimalisering og KI-orkestrering.