Source: Optimizely Evolution of Experimentation Report
More tests = more value. Even data says that’s not true.
Is it really as simple as more tests = more value?
When you’re getting your program up and running, say the first 12-18 months, yes - run as many tests as possible. That’ll help you build a data bank of successful stories with the aim of winning more resources and establishing a culture of experimentation.
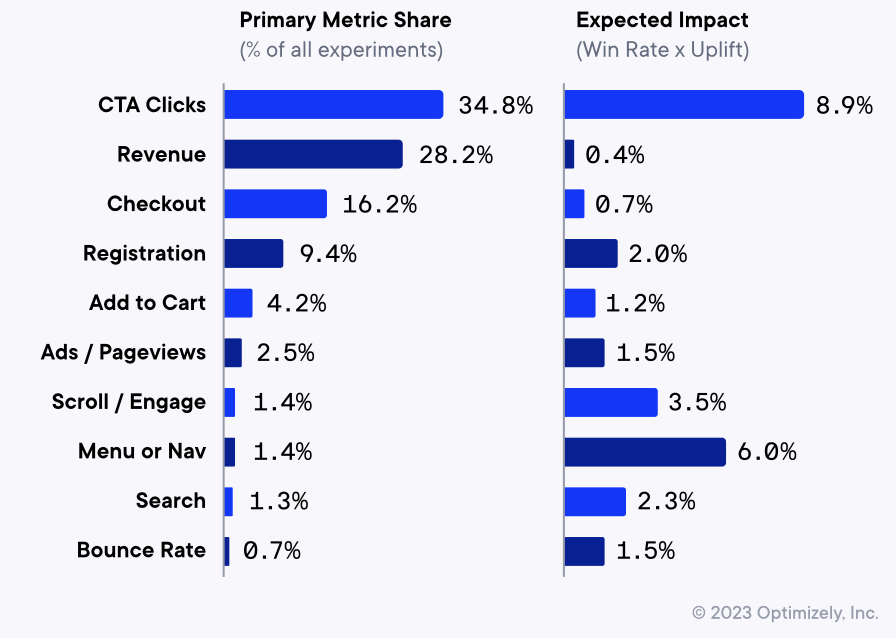
However, moving to the next level is not necessarily about increasing velocity. It’s about focusing on complexity and moving beyond cosmetic changes. Minute tweaks tend to result in minute uplifts. Our research showed us that the highest uplift experiments share two things in common:
- They make larger code changes with more effect on the user experience.
- They test a higher number of variations simultaneously.
More complex experiments that make major changes to the user experience e.g. pricing, discounts, checkout flow, data collection, etc. are more likely to generate higher uplifts.
The role of analytics
To track journey metrics and create compound metrics, you need your data to work together. But most experimentation programs face a fundamental obstacle as their data lives in silos. Web analytics in one place, customer data in another, and experimentation results somewhere else entirely.
This is where warehouse-native analytics changes the game.
- Test against any metric in your warehouse, from revenue to lifetime value, without complex data pipelines.
- Answer sophisticated business questions in minutes, not days. Generate cohort insights on the fly.
- Run experiments across the web, email, and CRM using Stats Engine, all analyzed in one place.
- Keep sensitive data in your warehouse while running sophisticated experiments.
- End metric debates with everyone working from the same warehouse data.
See why warehouse-native analytics is the present and future of data-driven experimentation.
Also, your analytics capabilities should go beyond just consolidating data. The list includes:
- Heatmapping: Move beyond basic click tracking to understand how user interactions translate to revenue across your entire customer journey.
- Custom events: Break free from predefined events and track any user behavior that matters to your business, including complex interaction sequences and multi-step conversion paths.
- Multi-touchpoint attribution: Understand how experiments impact the entire customer journey, tracking cross-device paths and measuring delayed conversion impact.
- Statistical Significance: Run sophisticated analyses without sacrificing speed, leveraging automated testing and sequential analysis to drive faster, more accurate decisions.
These capabilities will turn your analytics engine from a passive reporting system to an active insight generator.
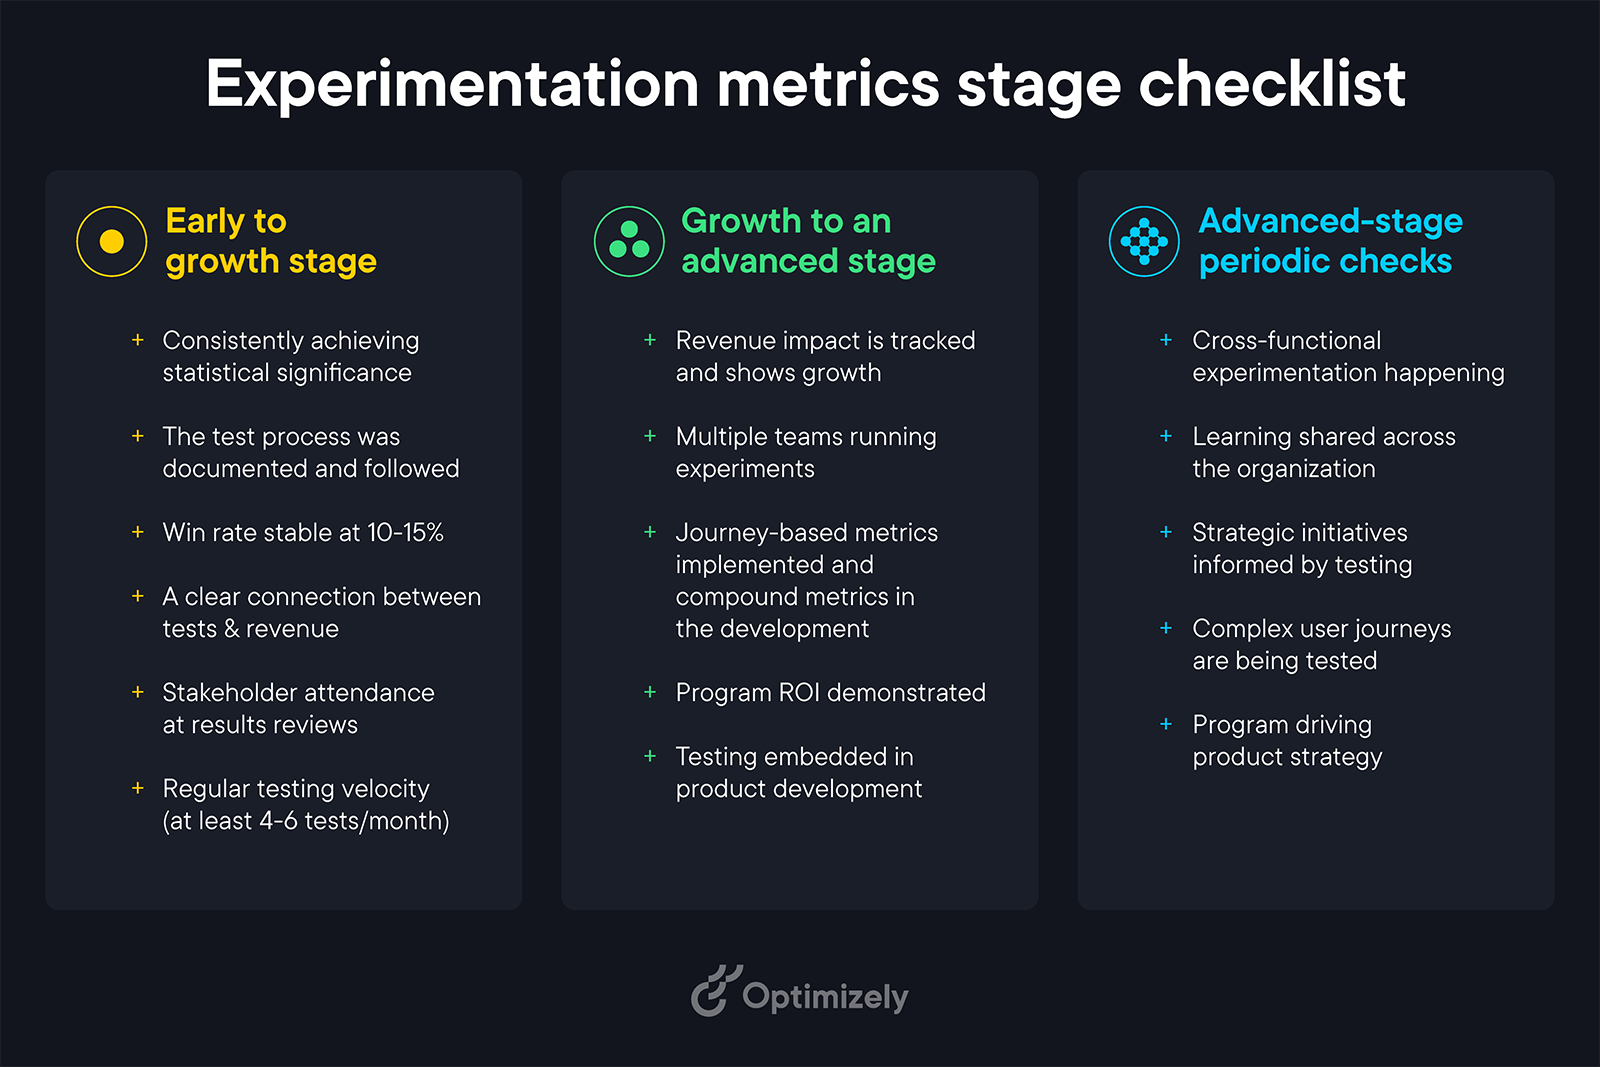
How to select metrics at different program stages
Every successful experimentation program goes through distinct stages. Here's how to evolve your metrics strategy at each phase and know when you're ready to level up.
1. Early stage: Building the foundation
At this stage, your primary goal is proving that experimentation works. You can start with two or three core metrics and a simple dashboard.