How to maximize KPIs with input metrics

To have a successful experimentation program, you have to start with “what is the goal?” of your growth and experimentation efforts. This was emphasized for me early at Optimizely, when our co-founder Dan Siroker said in an all hands just a few weeks in: “experimentation leaders choose metrics that matter.”
Understanding your most important goals is critical to defining the metrics to influence and other behaviors to drive forward via experimentation. Many companies know this top line KPI, such as Revenue or DAU (Daily Active Users), so we can then ask “What metrics and behaviors can I drive via experimentation on key pages to move these top line goals?”. A framework I’ve seen to be effective is defining input and output metrics.
Let’s define what we mean by input and output metric before going any further:
- Output Metrics – These are your end goal and what you measure success primarily for on your product or experience (e.g. for a retail app it would be purchases, revenue, and maybe loyalty account sign-ups)
- Input Metrics – These are the actions your users are taking that are good indicators of success to drive forward your output metrics (e.g. for the same retail app it could be the average number of products viewed per session or the in-app search rate)
Using this framework helps define what behaviors push forward that primary output metric.
As an example, let’s look at a retail customer who wants to increase sign-ups for it’s loyalty program, the input and output metrics might look something like the below.
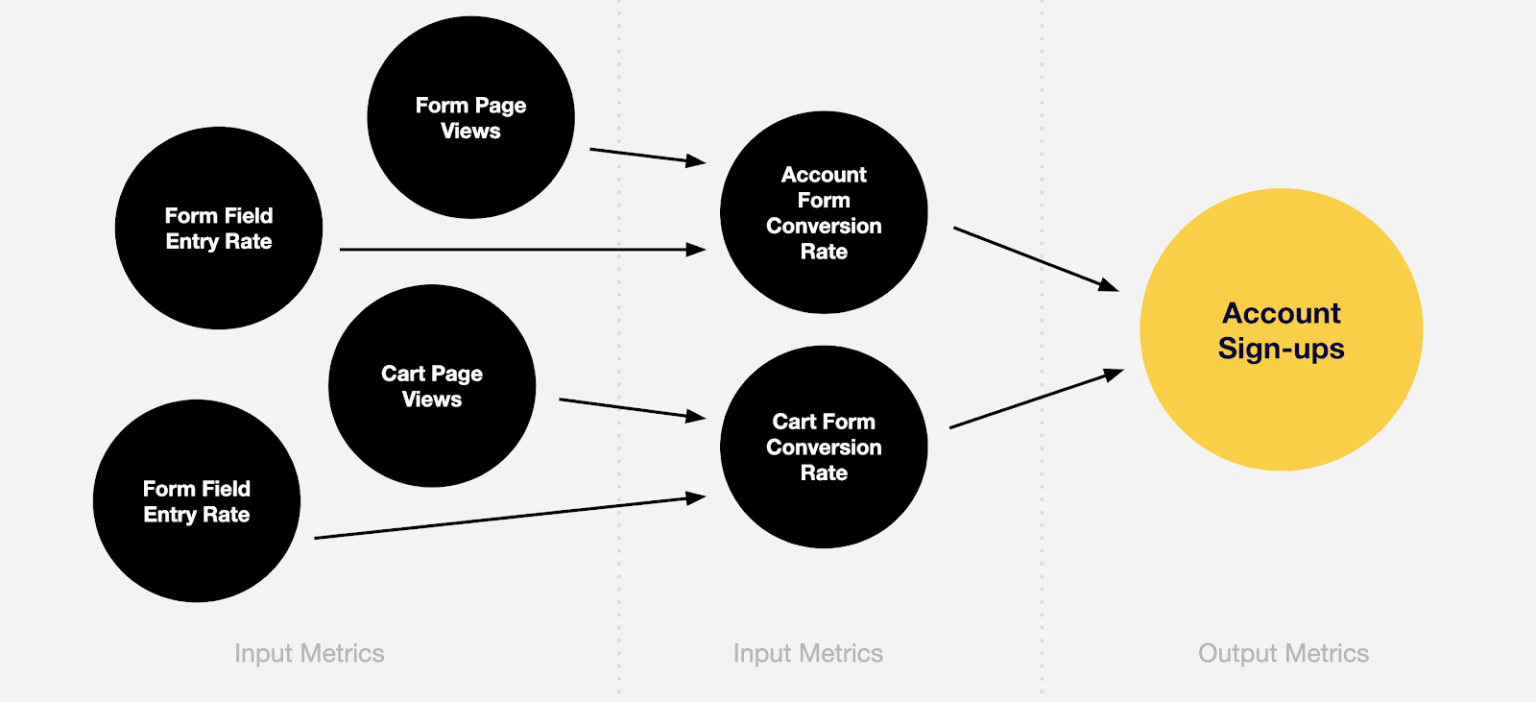
As you’re thinking about this for your own metrics, you should make this view as wide and deep as you can. What are all the actions that contribute to the success of your output metrics? From there, you can start to ask data-informed questions to create problem statements and outline your measurement plan for individual experiments.
Thinking of this holistically can be a challenge. What I’ve found to be useful is to outline the input and output metrics at a page-level for your most important customer journeys towards your primary output metric(s). Using retail again as an example, what are the primary journeys for a customer to make a purchase? Outline a page-level output metric for each of the pages in that journey and all the specific page input metrics. Here’s how Nike (or any retailer) could approach this for their product detail pages.
As you can see, the primary goal and output metric of this product detail page is a customer doing add to cart, but behaviors like scroll depth, image interactions and attribute selections are input metrics that help move customers toward the output metric. All together, a full user journey from a primary entry point (such as a product category page) would have the same site output metrics for every page, but different page-level ones.
When talking to customers, I often get the question “what should the page output metric be?” I like referring back to this blog post from Avinash Kaushik on avoiding web analytics mistakes and simply ask: “why does this page exist?” It should serve to get a user closer to your primary output metrics. Based on what step it serves to move the customer toward, that’s your page output metric! You can see an example user journey constructed of pages on a site below, continuing to use our retail example.
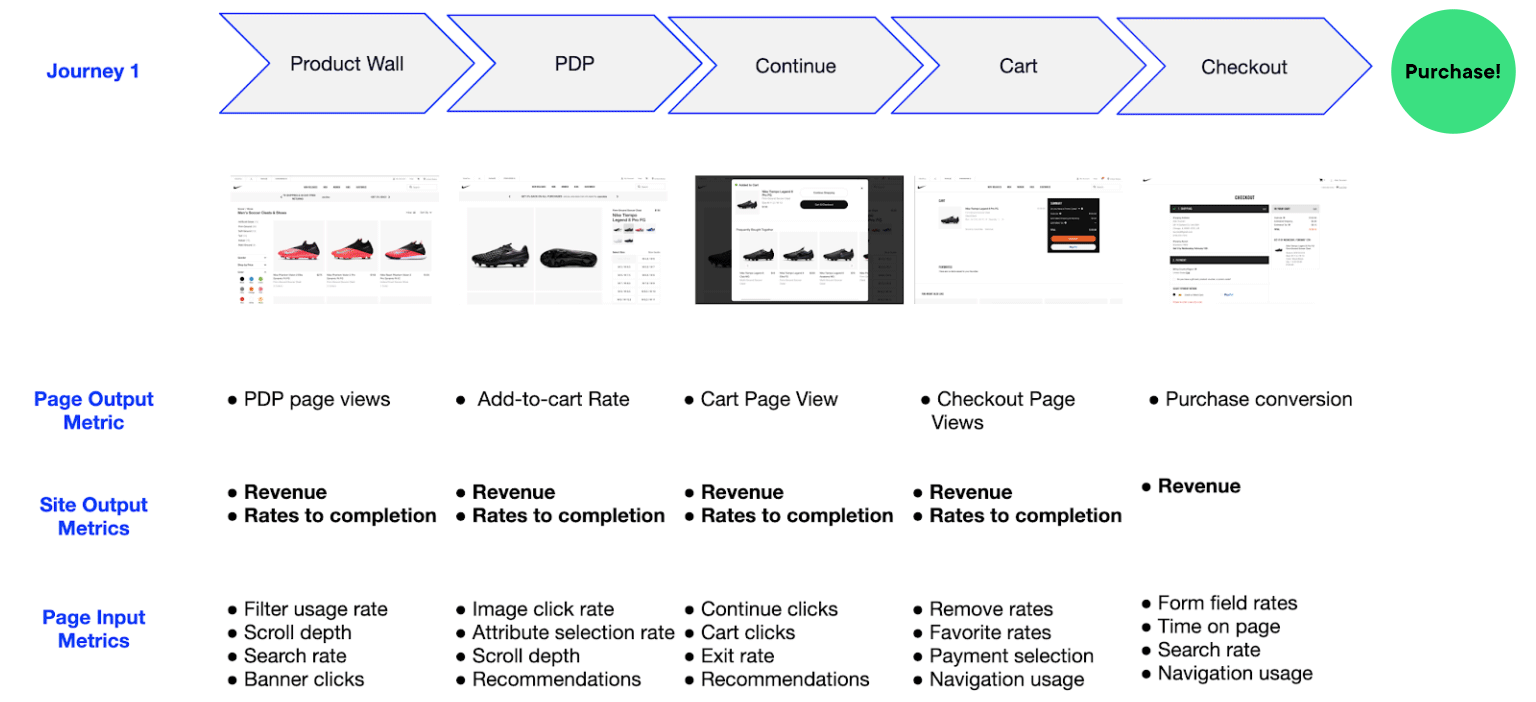
A user journey with a focus on the output metric for each page in the journey and its supporting input metrics
As you change the products and experiences through experimentation, your input metrics will likely shift, so it’s important to keep re-evaluation your input and output metrics and overall user journey. I’d recommend doing a re-mapping at least annually.
Have you done user journey mapping or input/output metric mapping? Any best practices you use in this process? Tweet us @Optimizely.
Ready to level up your experimentation practice? Reach out to us today.

Lead Strategy Consultant - Formerly a customer of Optimizely's, Alek led the American Medical Association's Digital Analytics team and Optimization Program. Today...
- Last modified: 4/28/2025 2:49:53 PM