Lessons learned from 173K experiments

In this 2026 report, see how programs are adopting AI, where they are scaling, and what separates top practitioners from those simply running more tests.

About the data

This analysis draws on these sources: the Optimizely experimentation benchmark (173k true experiments across 1,200+ companies, 2018–2026), Optimizely AI usage data (2025- 2026), and select Optimizely analyses.

Three terms come up throughout this guide: 

  • True experiment: A correctly configured test running in production with sufficient traffic: a control and at least one treatment variation, each with 1,000+ visitors, and no signs of being an A/A test. 
  • Winning experiment: A true experiment where the primary metric moves in the winning direction with at least 90% statistical significance. 
  • Average test impact, or ATI: Win rate multiplied by winning uplift. A 10% win rate times a 10% uplift equals 1% ATI. 

Note: "Users" means companies in the average usage band, not the extremes. And these comparisons are observational, not causal. Adoption was each customer's own choice, and adopters may differ from non-adopters in ways this data can'tfully isolate.

Top takeaways:

1

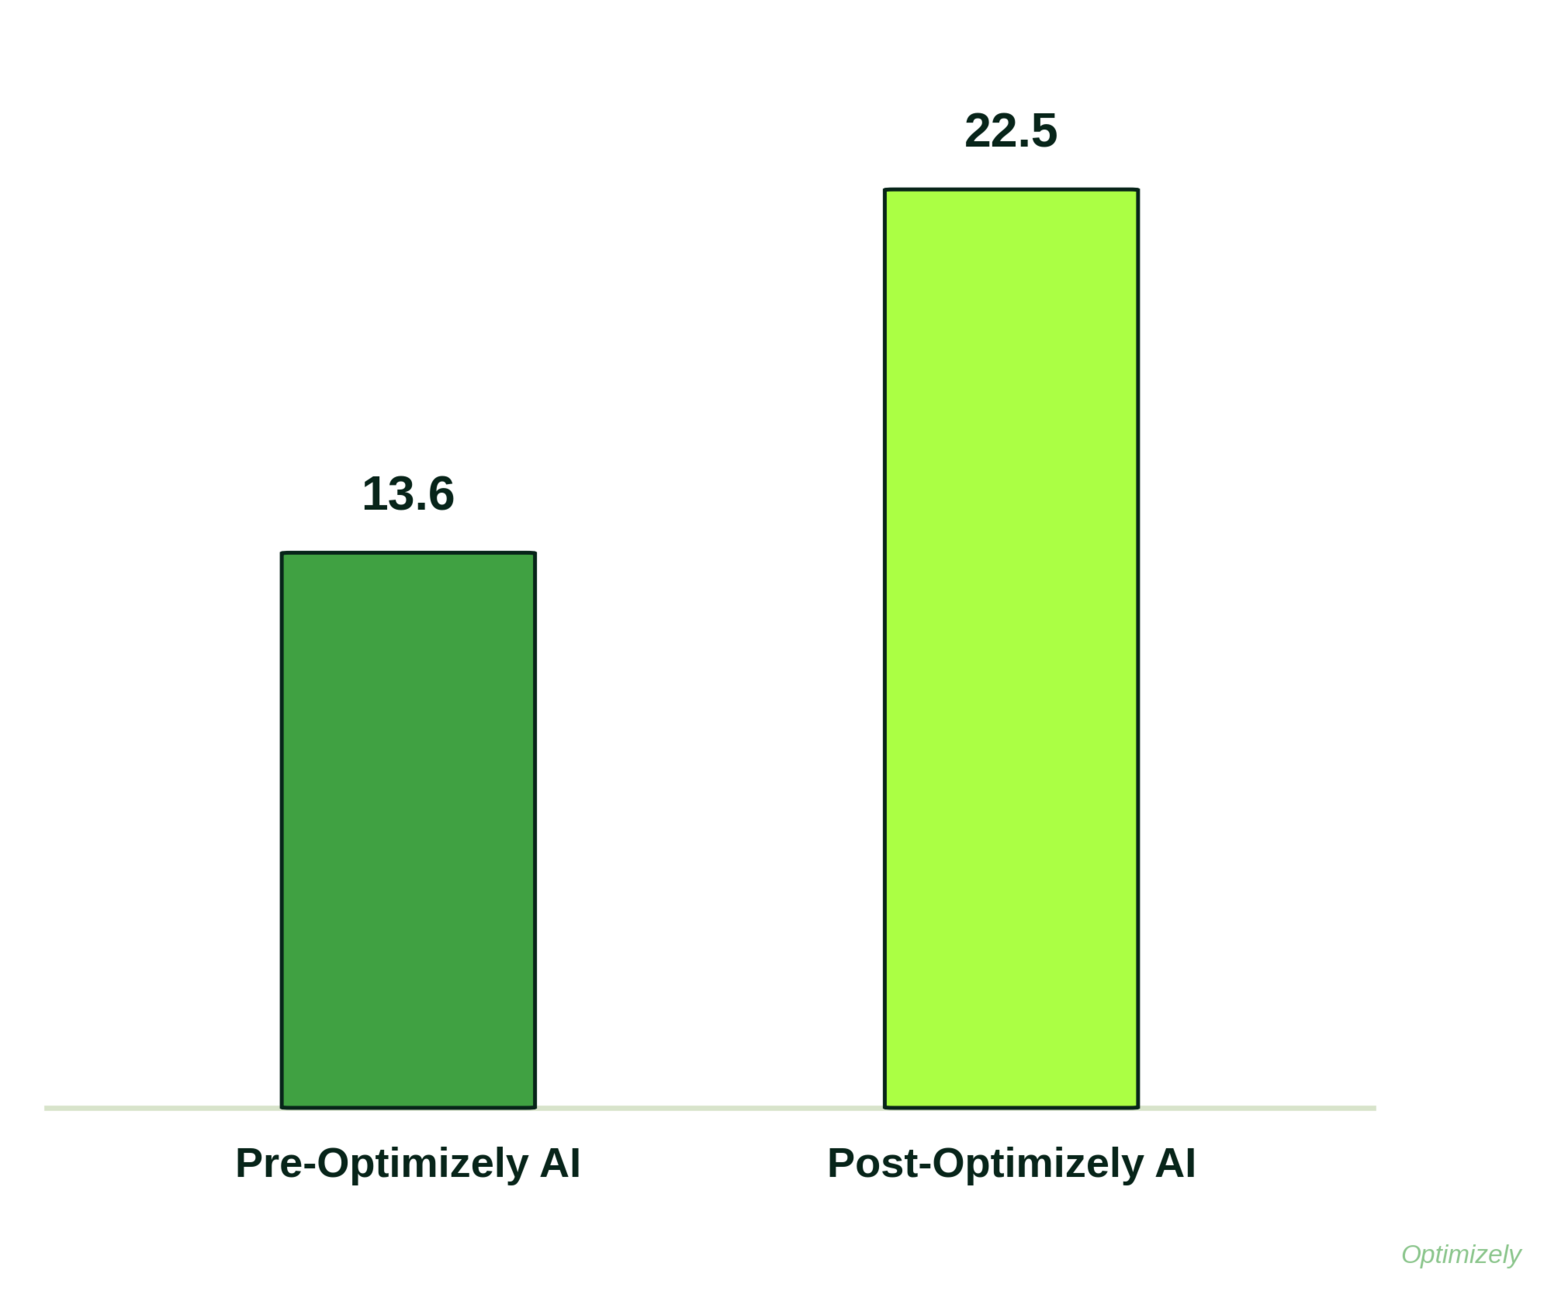
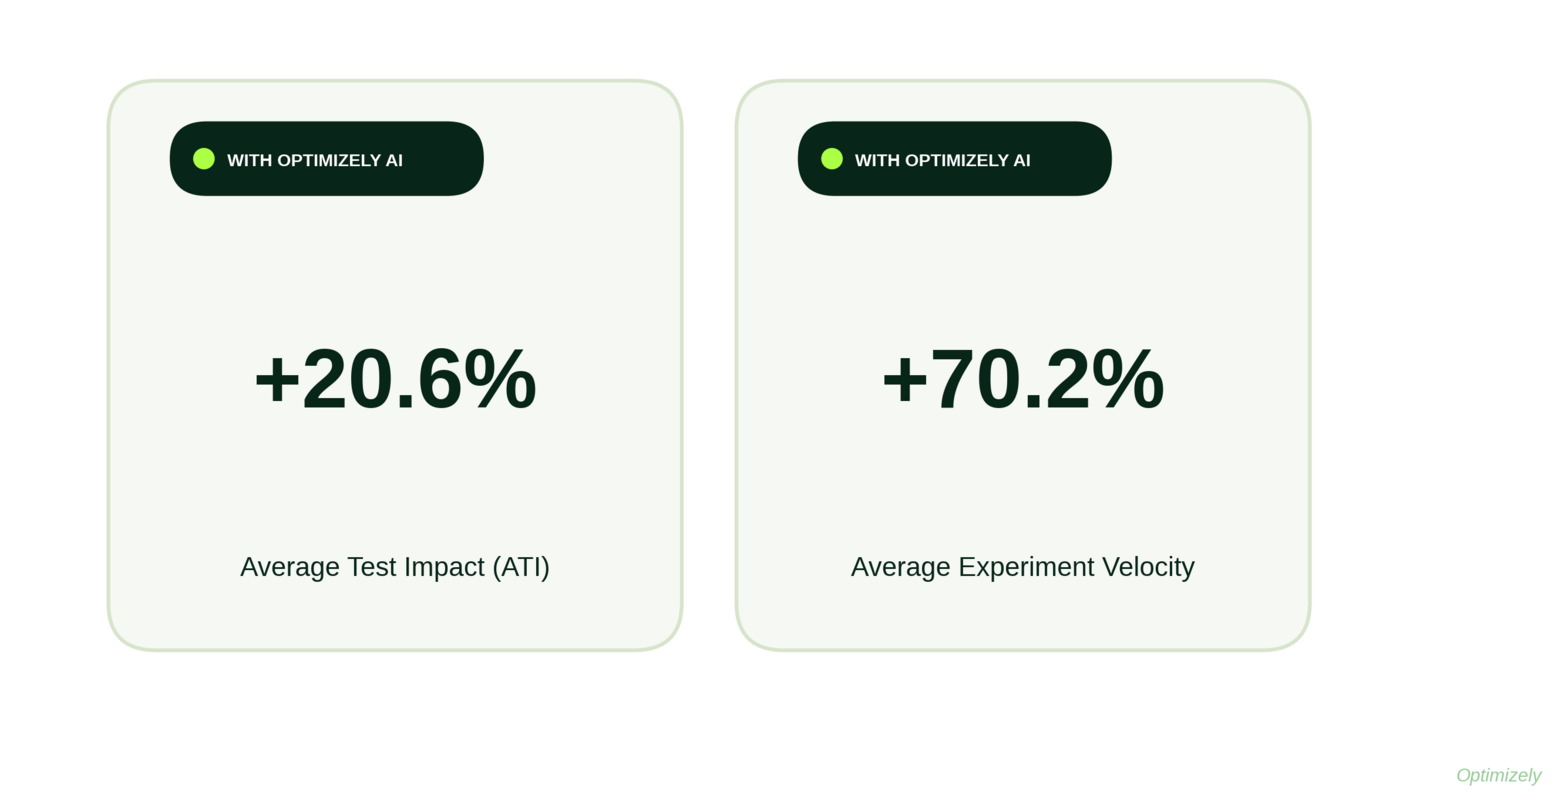
AI has been adopted faster than any experimentation product within the analyzed dataset, and the customers using it see results: Optimizely AI customers in the average usage band show +20.6% average test impact (ATI) and +70.2% experiment velocity versus the pre-Optimizely AI baseline, and outcomes trend upward with usage. 

2

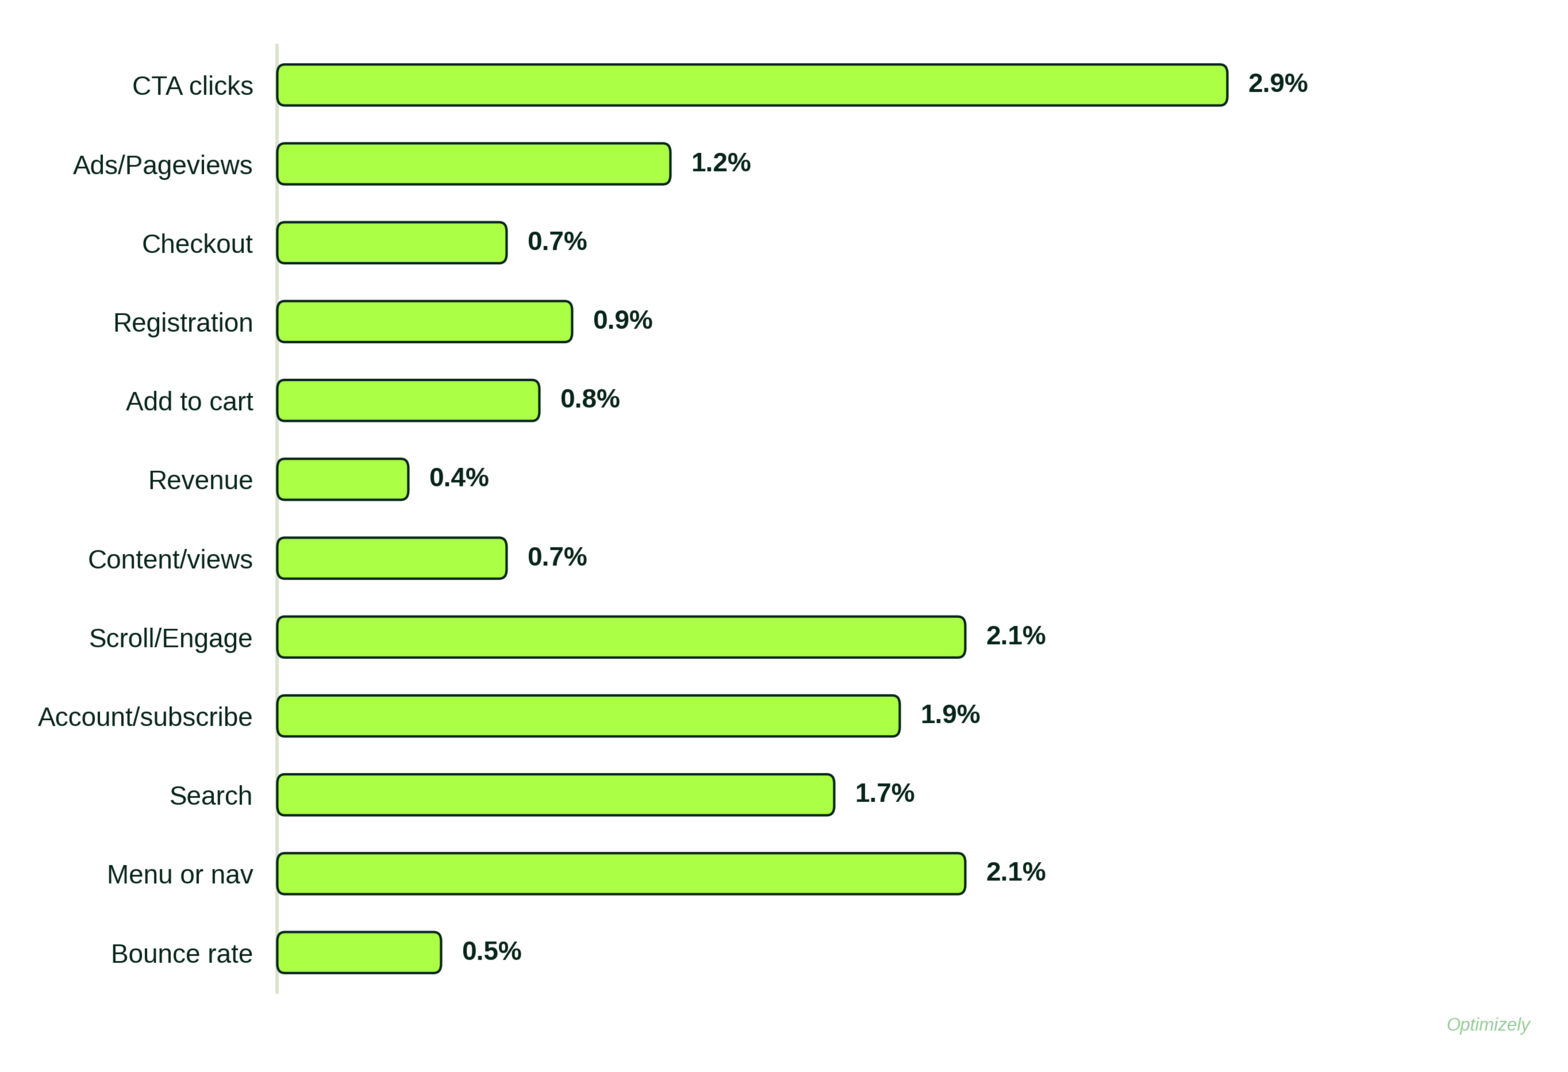
Across industries, the metrics that deliver the most impact are the ones teams use least. Users of Optimizely AI show higher rates of testing on those neglected, higher-impact metrics. 

3

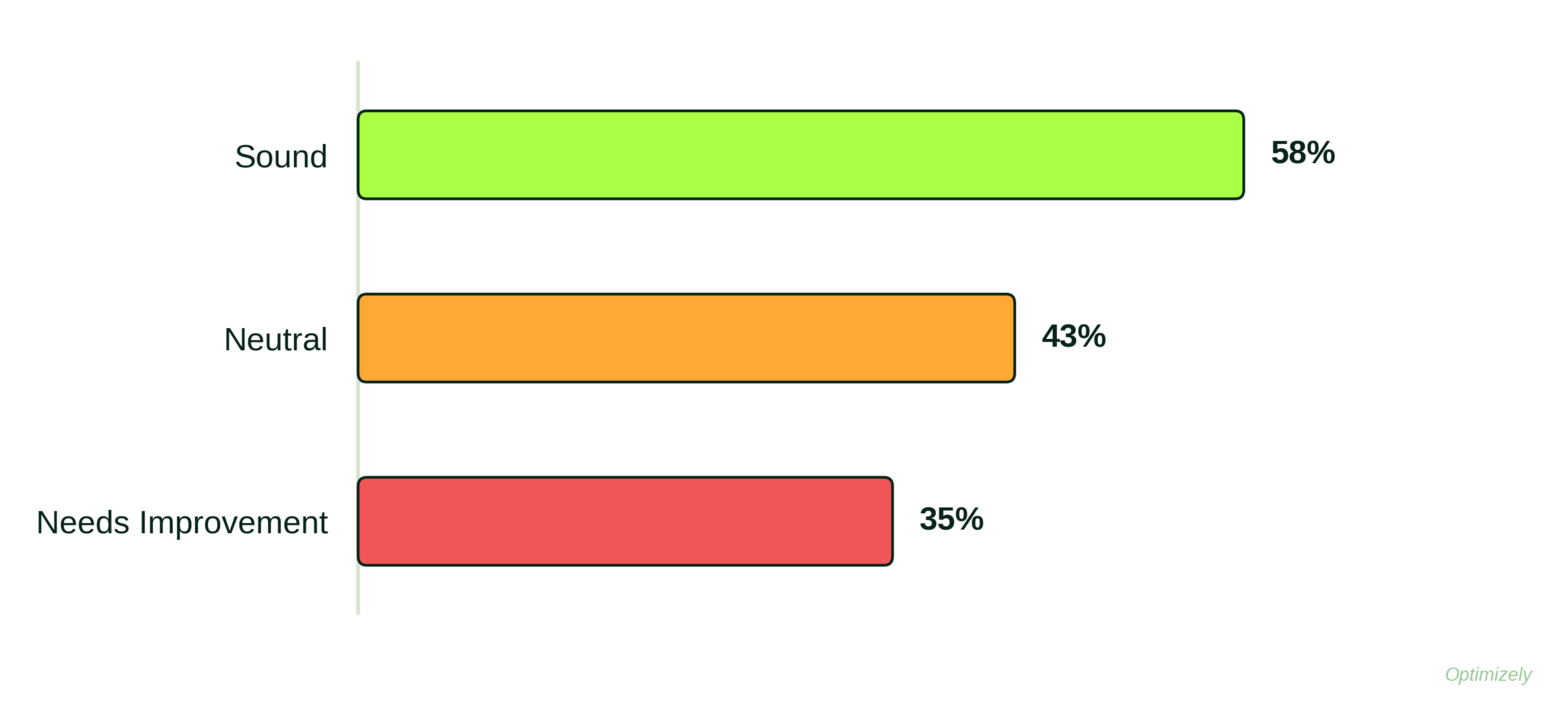
Setup, funnel position, and traffic allocation are the highest-leverage planning decisions a team makes. Sound experiments win 23 percentage points more often than poor ones (58% vs. 35%); the most impactful metrics sit at the top of the funnel, not the bottom where 43% of tests run; experiments using Stats Accelerator show a 17% higher conclusivity rate (26.0% vs. 22.3%), with the advantage holding at every variation count. 

4

Personalized web experiments generate a 17.4% higher average test impact (ATI) on their targeted audiences, and after adopting Optimizely AI, companies in the average cohort run 65.4% more of experimentsper year.

5

More variations and more substantial changes have always been associated with greater returns, but the cost was developer time. AI changes the economics of building, and Optimizely AI customers build measurably more multi-variation and multi-change tests.

6

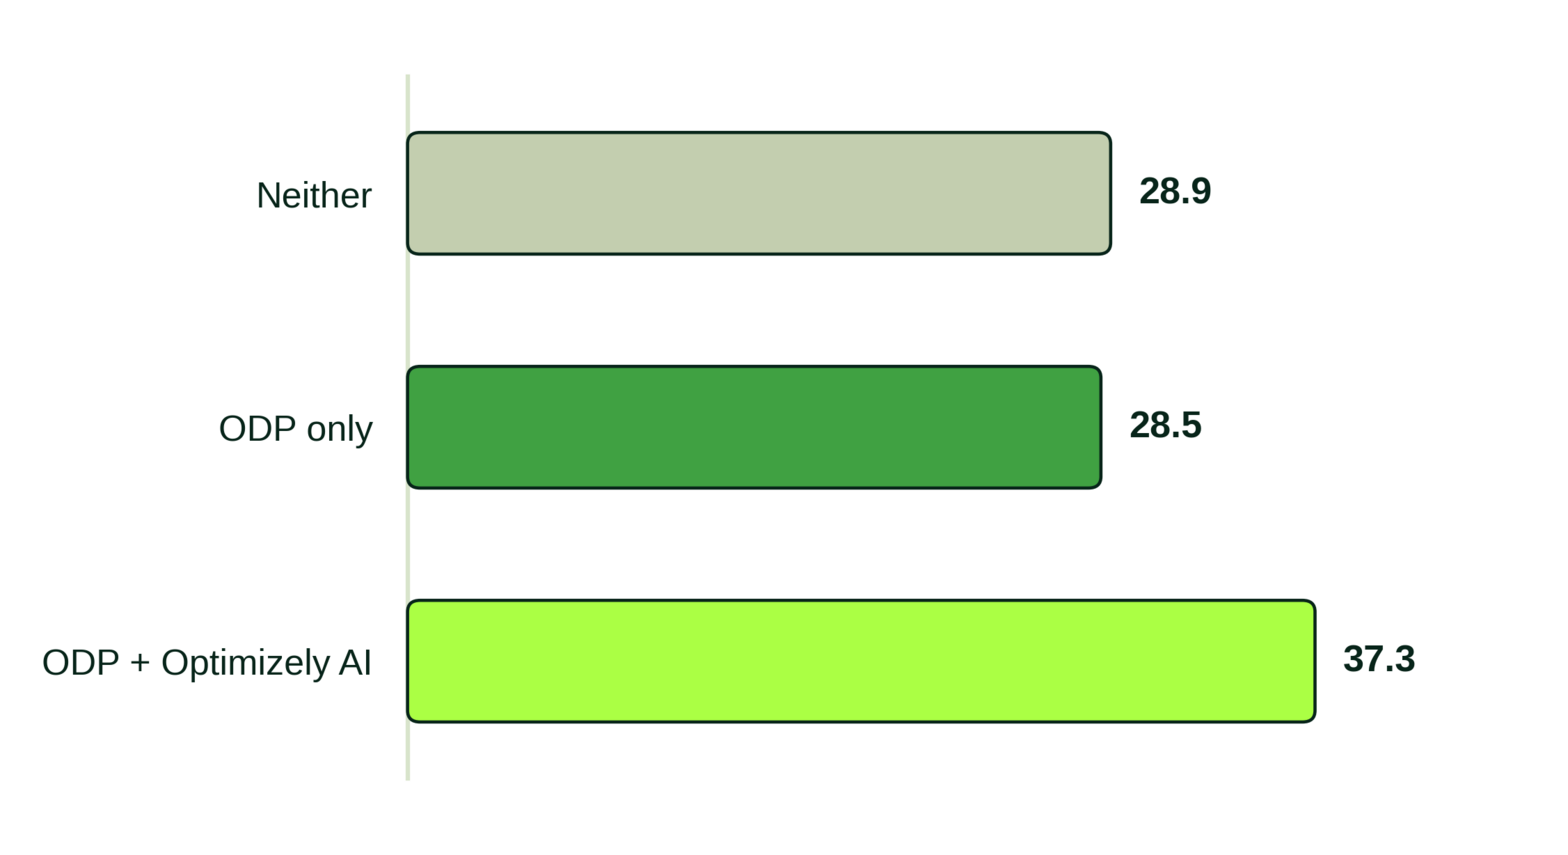
A stronger data foundation is consistently associated with higher test impact (companies experience ATI lift of 33.3% after adopting Optimizely Analytics) but historically it cost velocity, because richer data means more involved tests. That trade-off does not appear for ODP customers using Optimizely AI: they show the highest impact of any data foundation in our benchmark alongside a 29.1% velocity gain.


What happened after programs adopted AI

Optimizely AI customers in the average usage band show +20.6% average test impact (ATI) and +70.2% experiment velocity versus the pre-Optimizely AI baseline, and outcomes trend upward with usage.

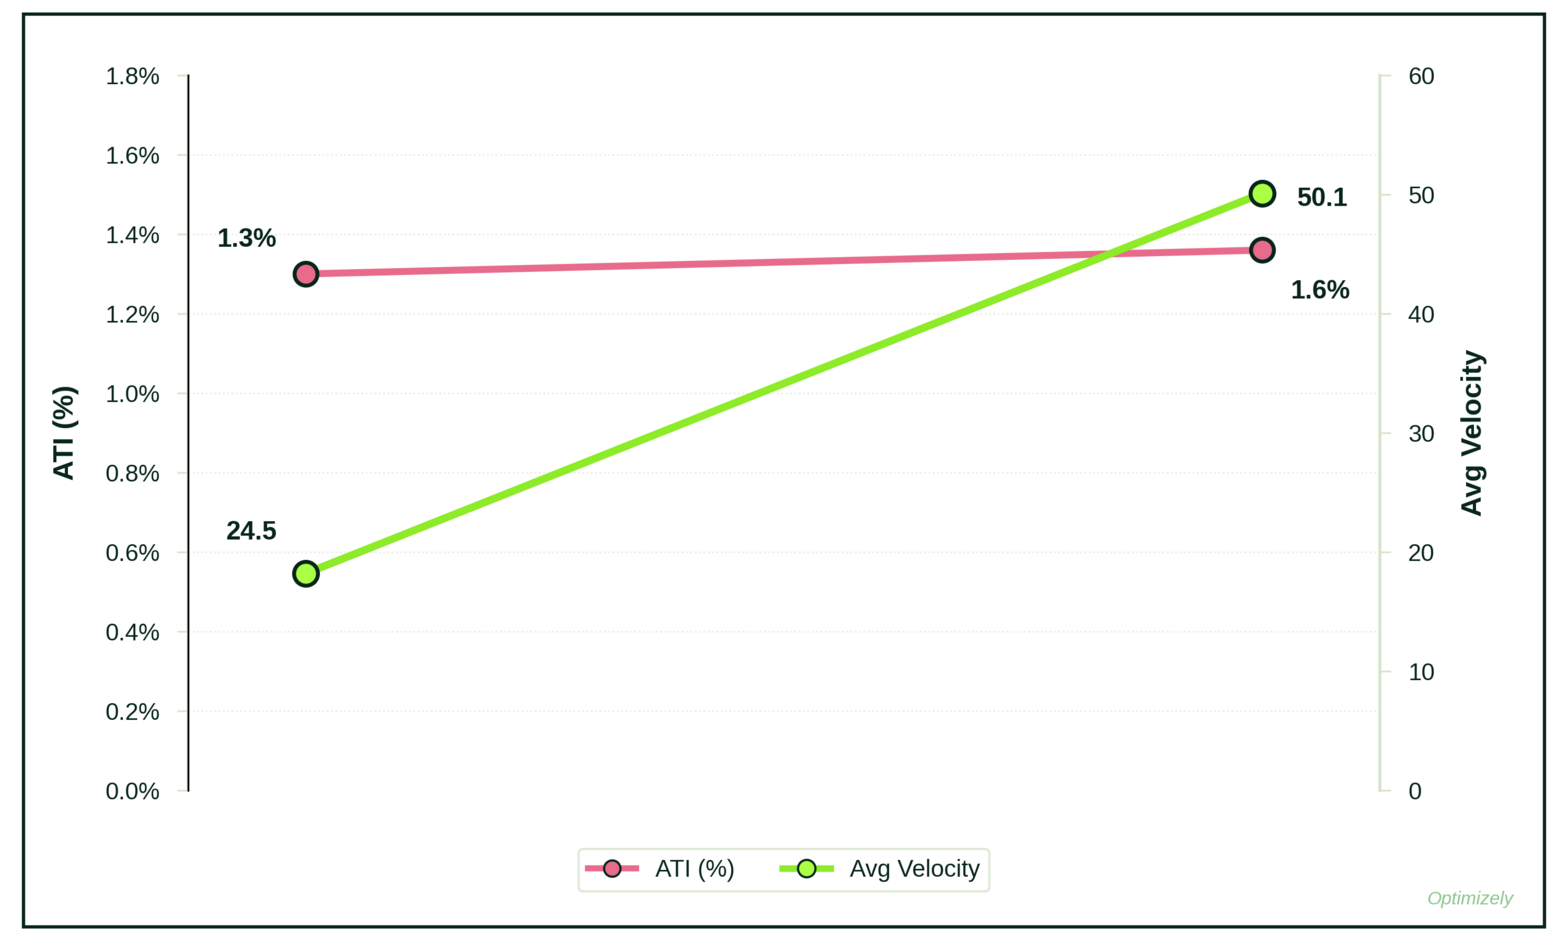
The effect wasn't a one-time bump. The more a program used it, the more experiments it ran, and the bigger the impact of each one. Heavy users run roughly twice as many experiments as non-users, and Average Test Impact (ATI) climbs from 1.3% to 1.6% across usage tiers.

Gains varied by industry where highest adoption often results in highest improvement:

  • Information Technology saw the largest jump, with average test impact rising from 0.5% to 6.3%.  
  • Wholesale & Distribution followed at +5.5 points. 
  • Then Home and Garden at +1.7.

Analyst Report

Optimizely: A Leader and A Customer Favorite

Optimizely has been named a Leader and a Customer Favorite in The Forrester Wave™: Experience Optimization Solutions, Q3 2026. Optimizely received highest possible scores in criteria including web and feature experimentation, and customers called Optimizely's agentic AI a "game changer."

The experimentation lifecycle, re-imagined

The fundamental experimentation lifecycle has not changed. Teams still ideate, plan, personalize, build, and analyze their tests. But how that work gets done within the lifecycle is drastically different with AI, resulting in much greater automation, velocity, and quality of output. This paper is organized along that lifecycle. Before walking through the stages, we start with the biggest shift in our data: the arrival of agentic experimentation itself.
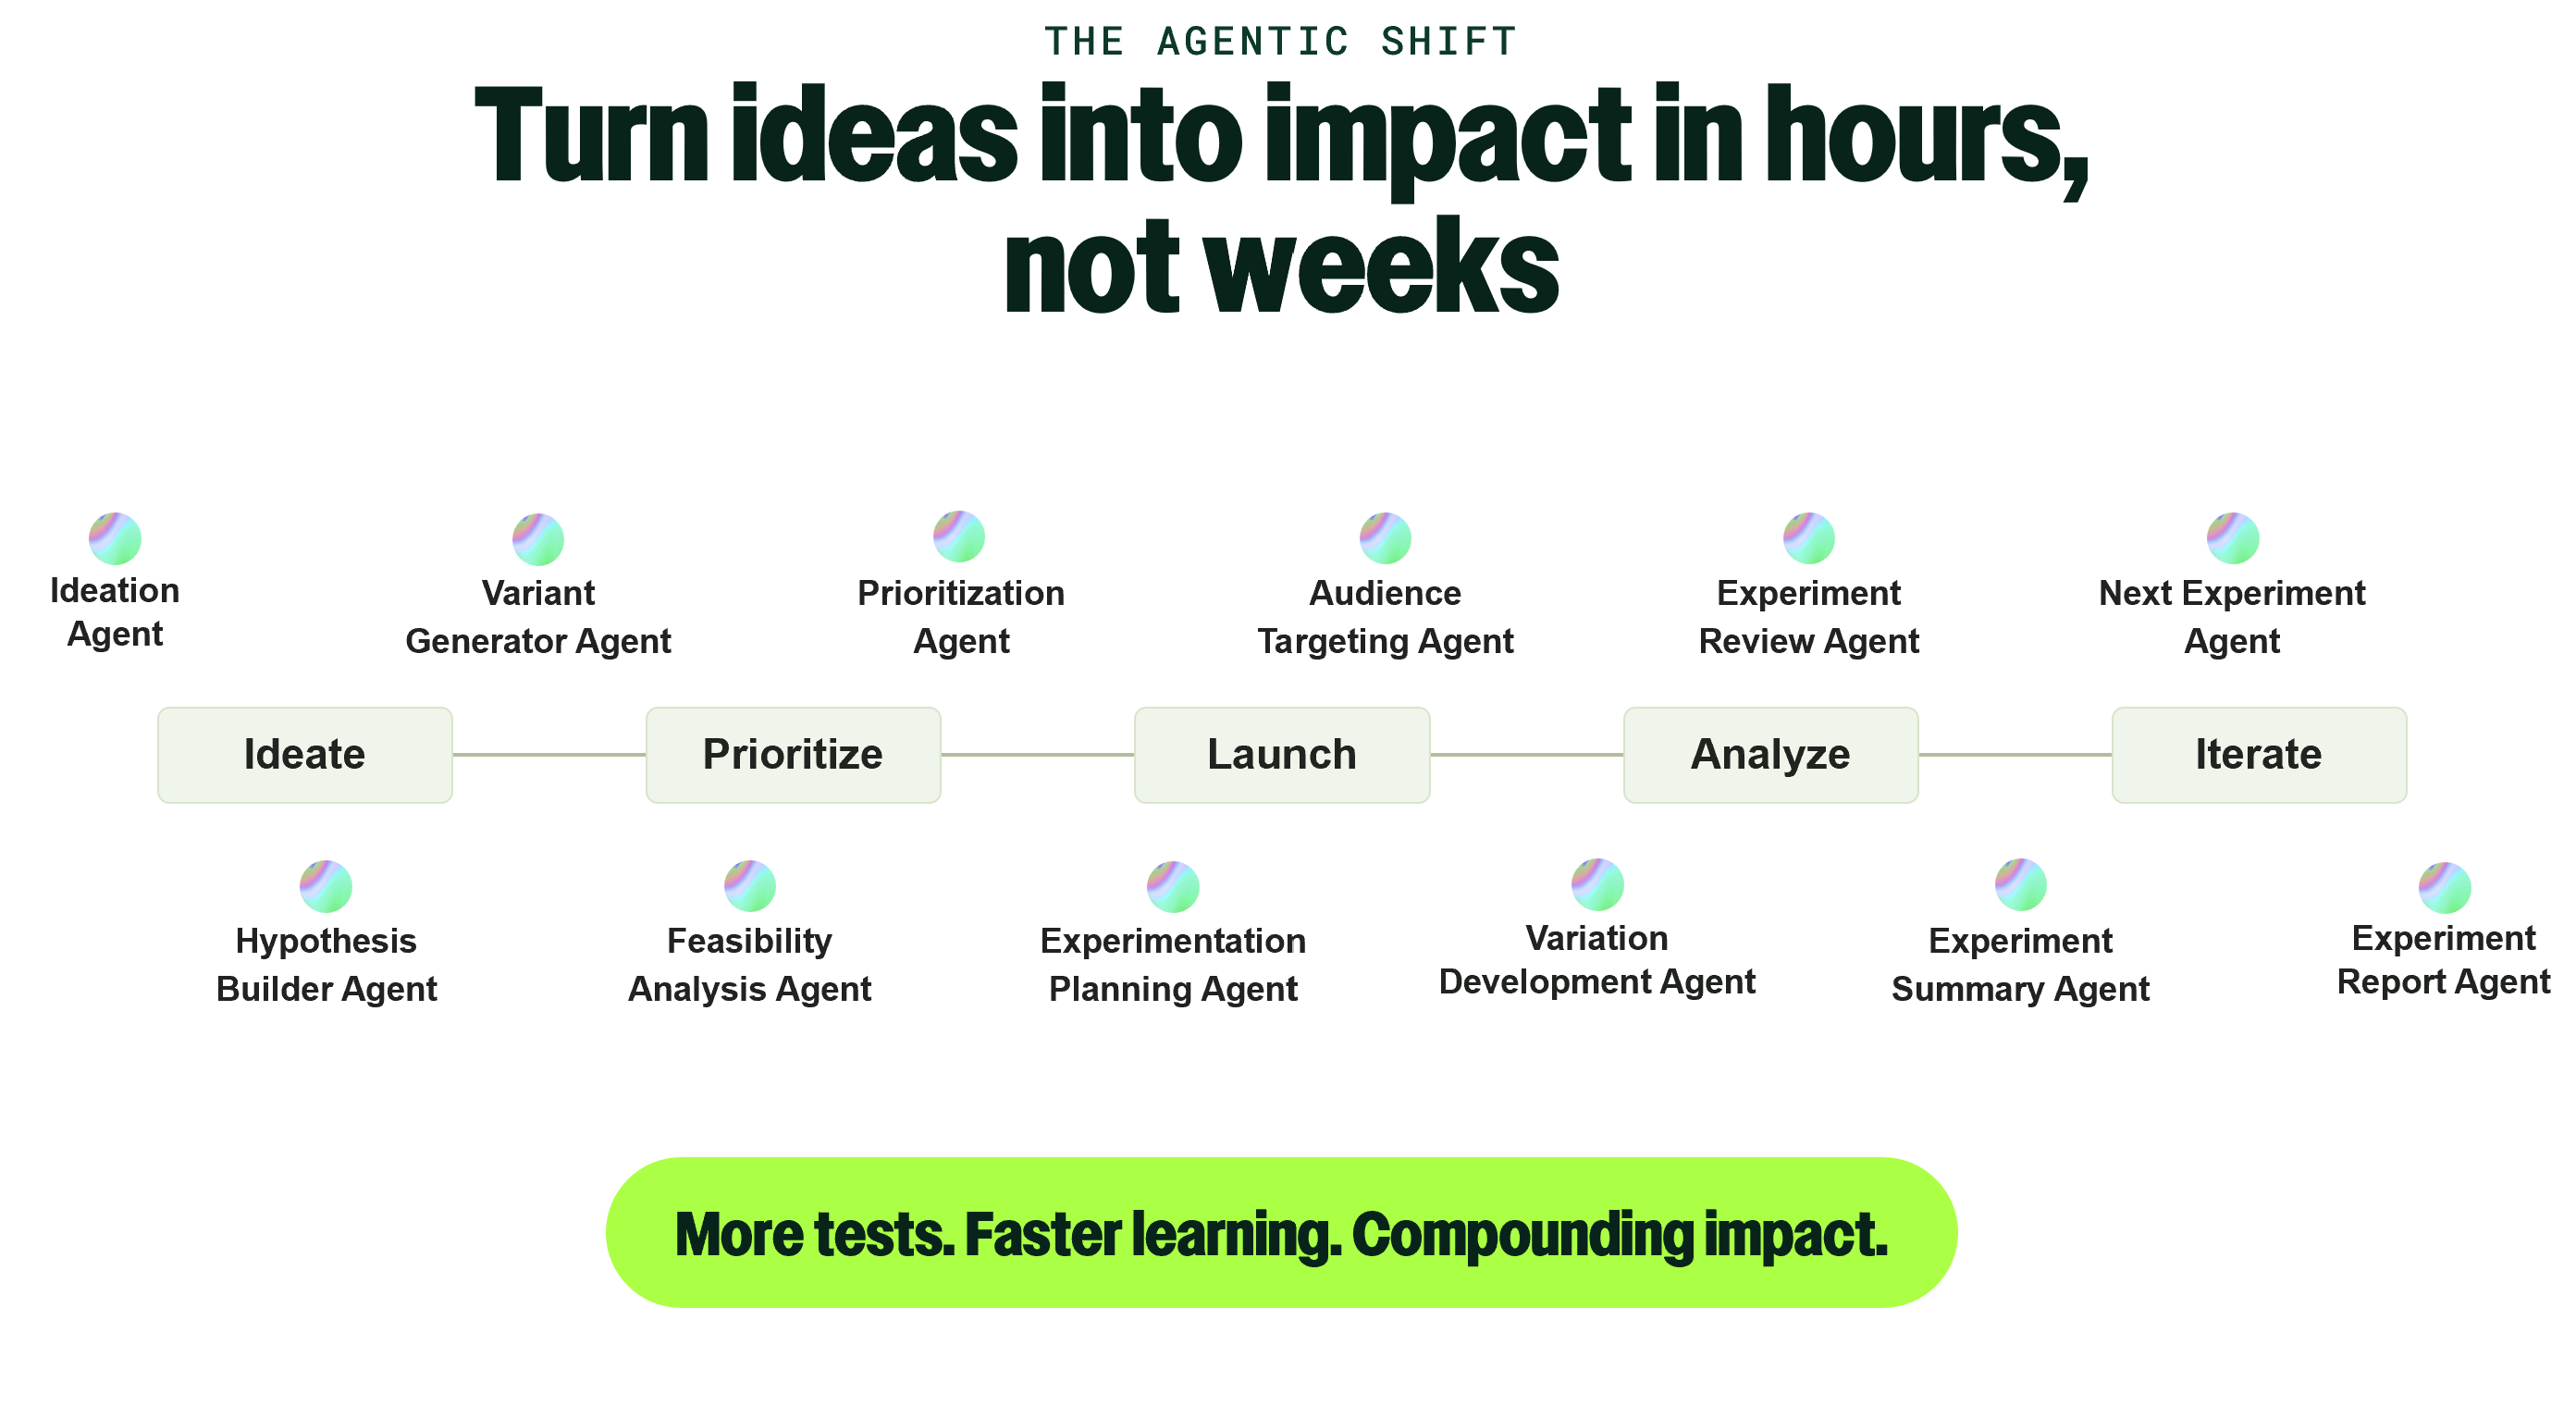
Agentic experimentation lifecycle with AI

1. Ideate

A good experiment starts with a good idea.

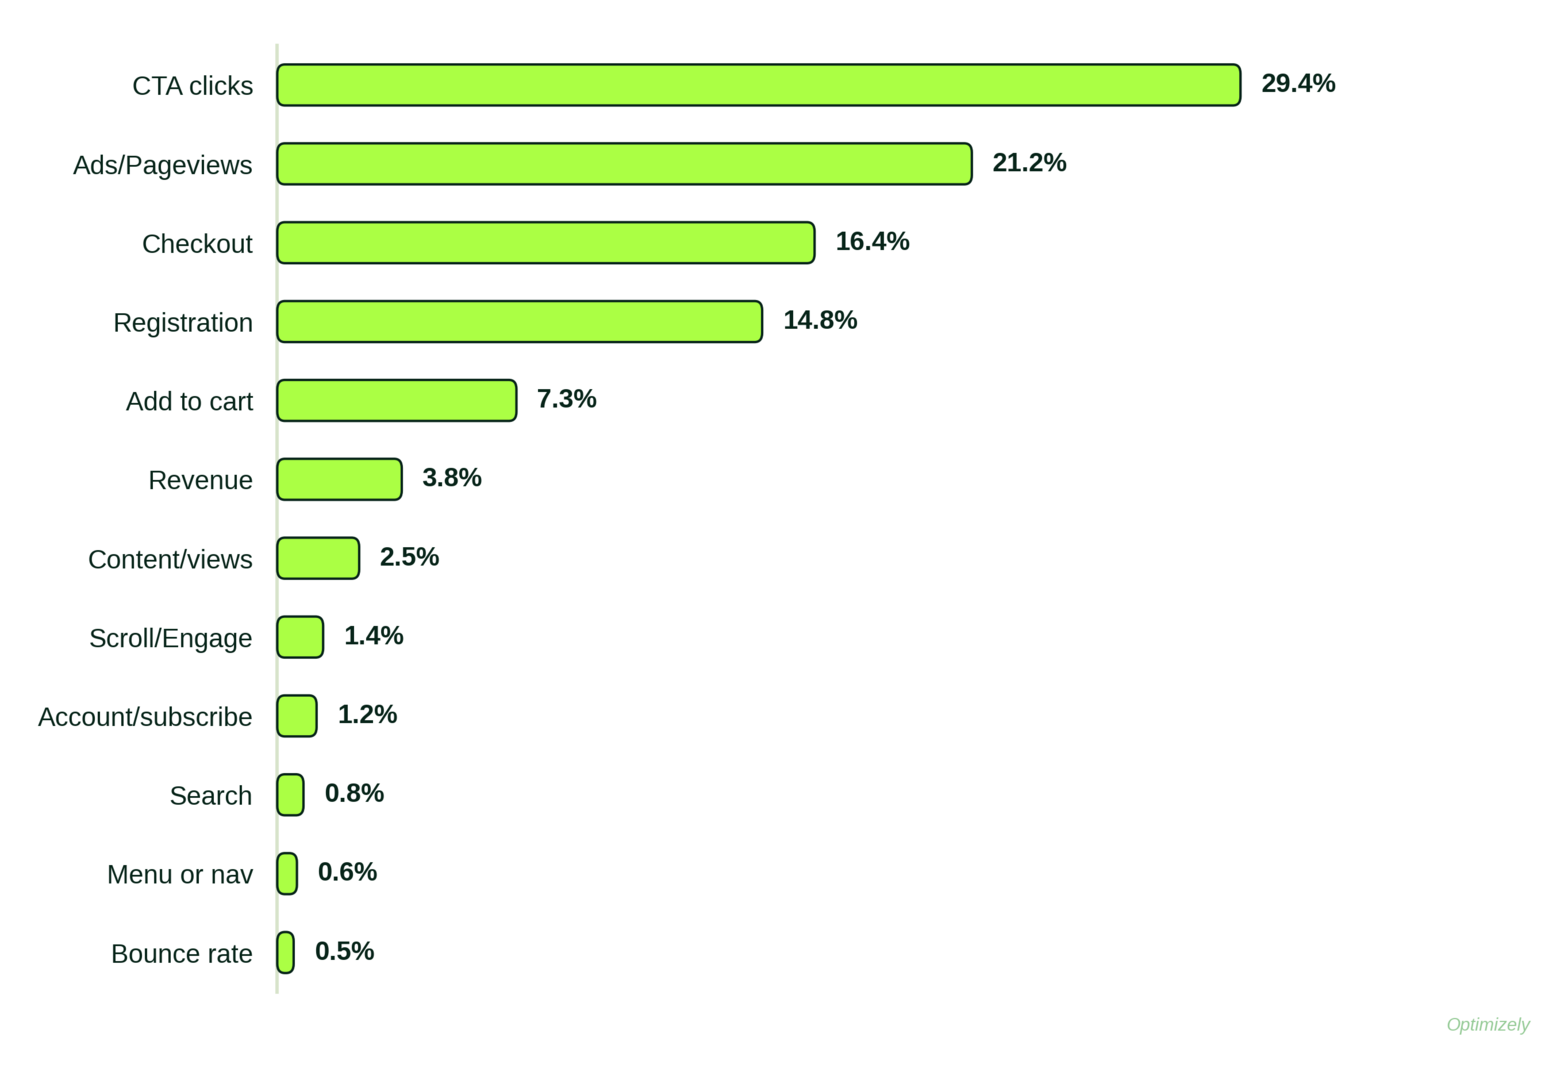
Over 90% of experiments target five common metrics: CTA clicks, pageviews, checkout, registration, and add-to-cart.

Our research indicates that some of the most impactful primary metrics are the least tested.

2. Plan

Setup quality is the single biggest predictor of win rate.

Sound experiments win 23 percentage points more often than poor ones (58% vs. 35%). Investing in setup quality is one of the highest-leverage improvements teams can make.

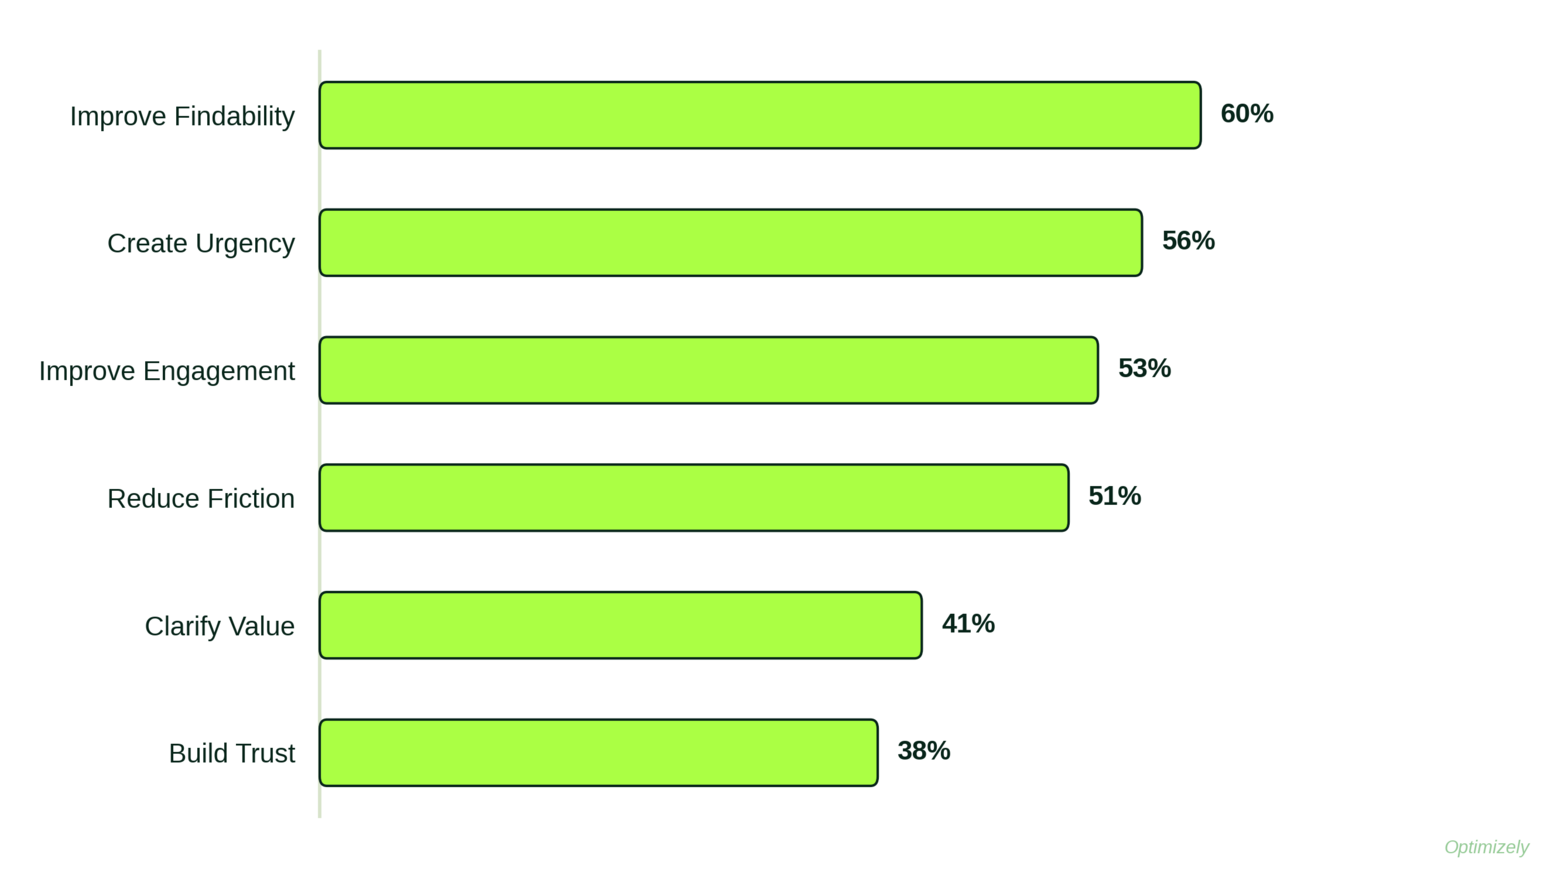
When choosing a hypothesis, most teams default to a "Clarify Value" hypothesis, the safe first draft of a test plan. It's the choice in over a quarter of all experiments, and it only wins 41% of the time. Findability and Urgency hypotheses barely register by comparison, just 14% of tests combined, yet post the two highest win rates in the dataset: 60% and 56%.

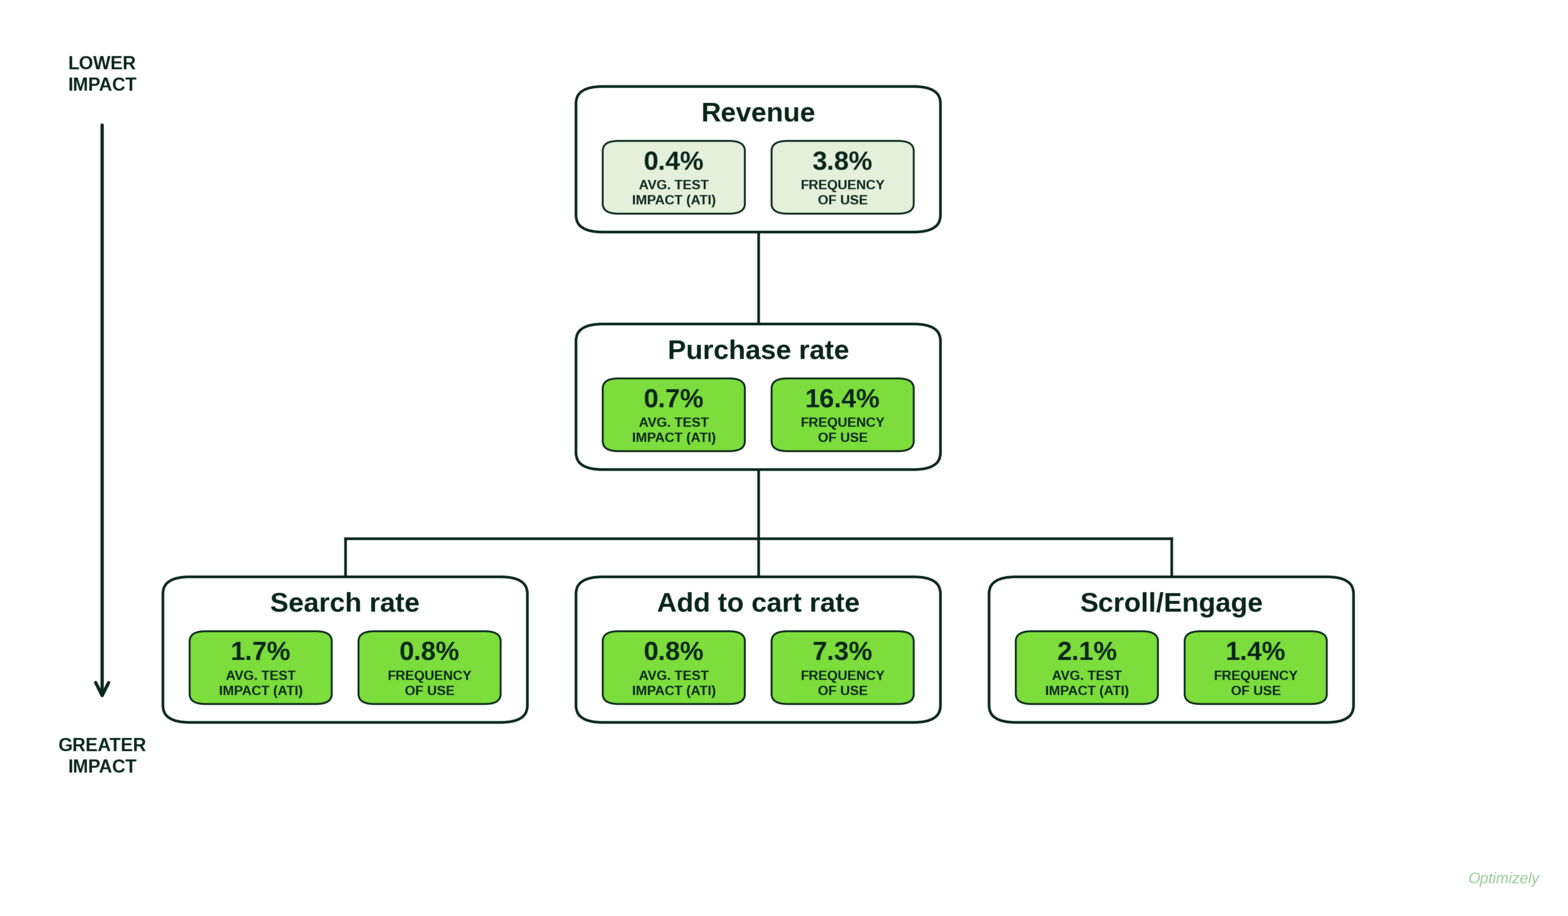
Testing still clusters at the bottom of the funnel: 43% of all tests target it, where gains are the most incremental and hardest to detect. Post-conversion testing barely exists, at 4%. Scroll and engagement metrics sit at just 1.4% of tests but deliver one of the highest ATIs of any funnel metric, 2.1%. Revenue-per-visitor and purchase rate, by contrast, are used over 20% of the time but deliver only a third to a fifth of the value.

3. Personalize 

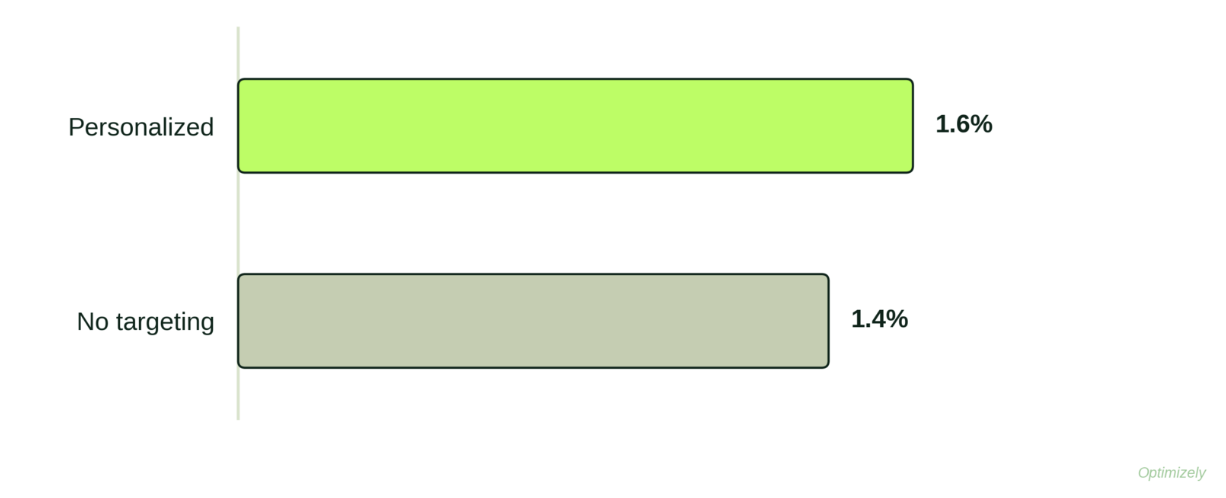
Audience-targeted experiments generate 17.4% higher ATI on the audiences they target, though that can be diluted if the audience is small relative to total traffic.

This impact might be mitigated by the reach of the audience if the targeted audiences sum to less than the total traffic.

Also, after adopting Optimizely AI, companies run 65.4% more personalized experiments per year.

4. Build 

The number of variations you build and the substance of the changes you make are among the strongest predictors of how much a test returns. AI changes the economics of building. 

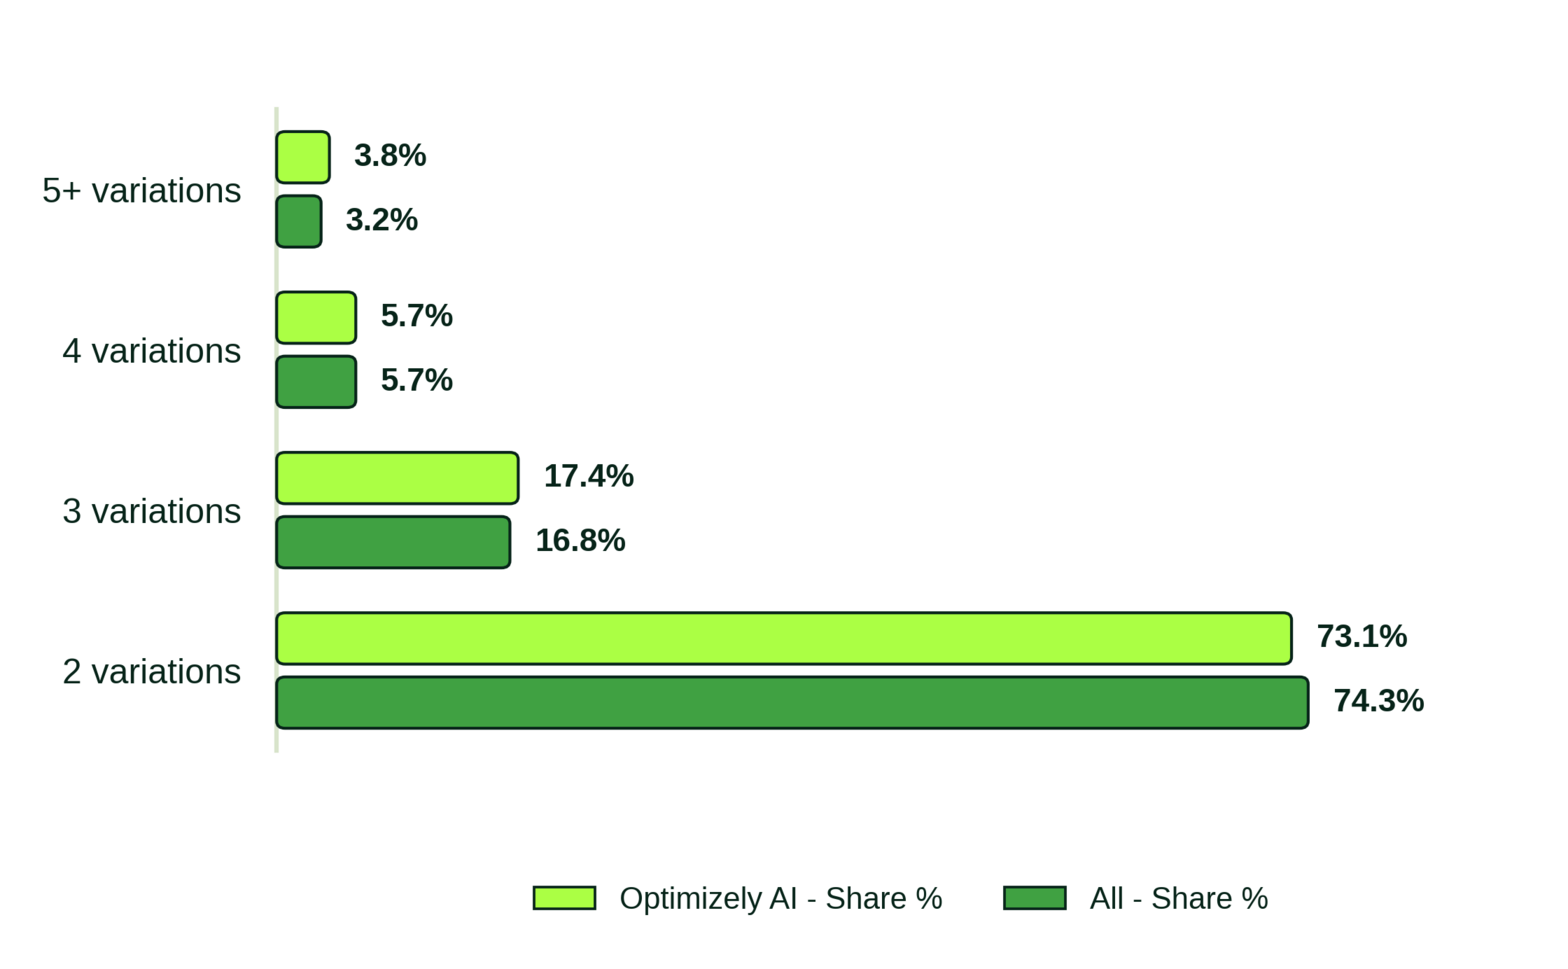
3 out of 4 experiments are still simple A/B tests yet multi-variant tests deliver up to 1.7x more impact.

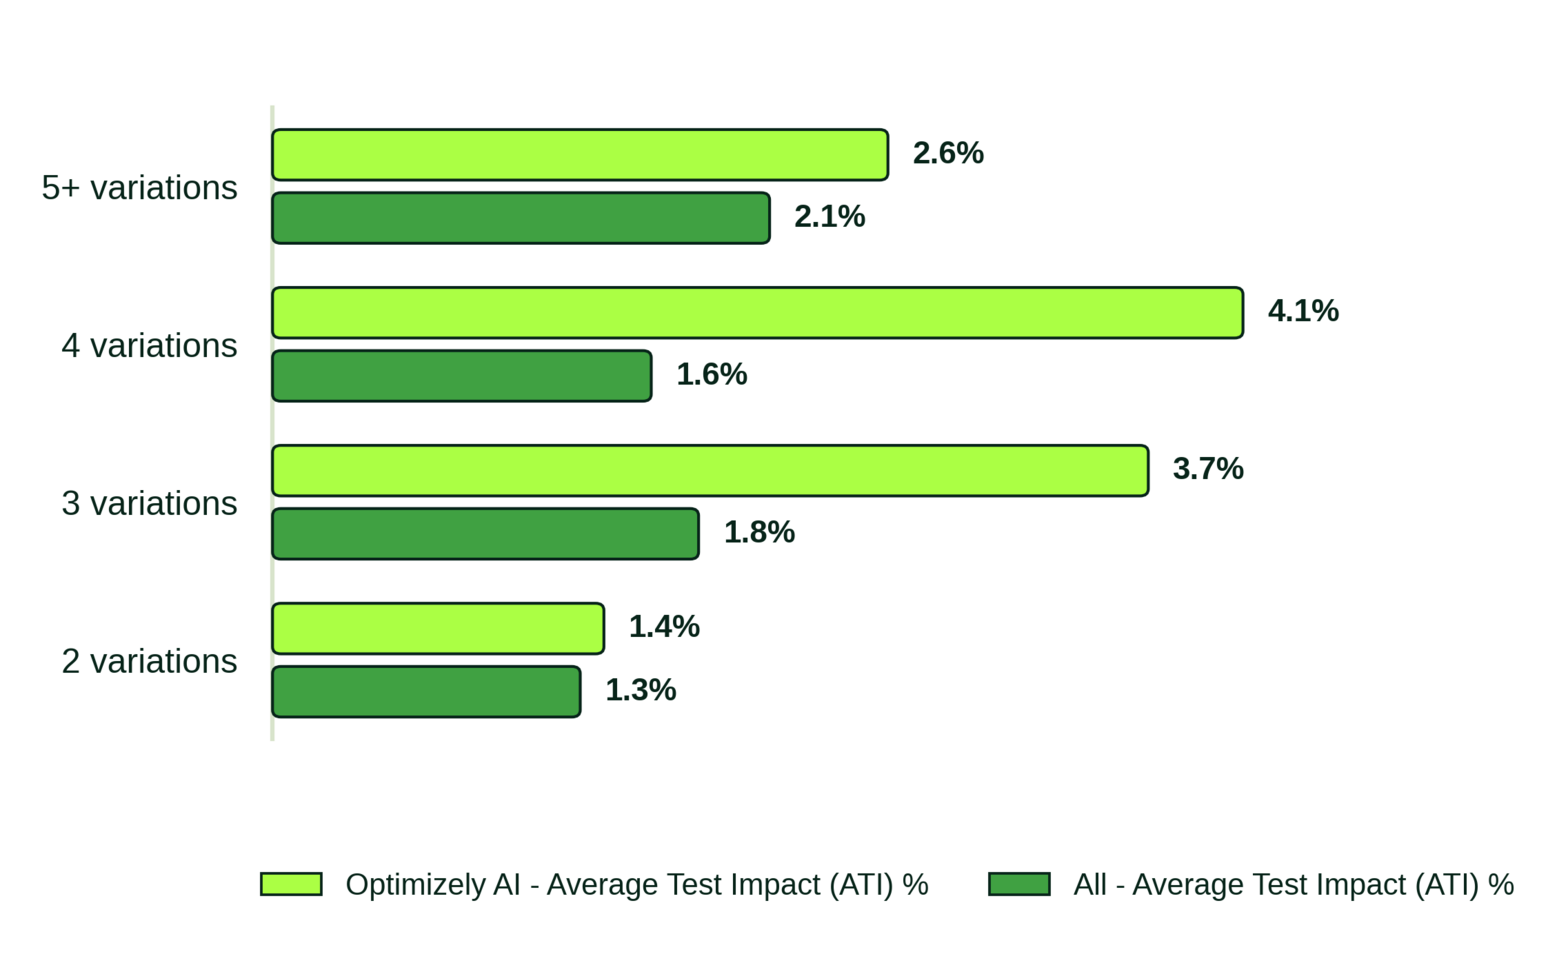
The gap is widest in multi-variant tests: at 4 variations, Optimizely AI experiments show 4.1% average test impact (ATI) against 1.6% for non-Optimizely AI experiments.

The mix of what gets built also differs: Optimizely AI customers run a higher share of 3- and 4+-variation tests. 

Multivariate tests are the extreme version, testing every possible combinationat once. They're rare, just 0.15% of experiments. But the ones that finish hint at real potency: of 44 meeting quality criteria, 8 produced significant winners, with a median uplift of 57%.

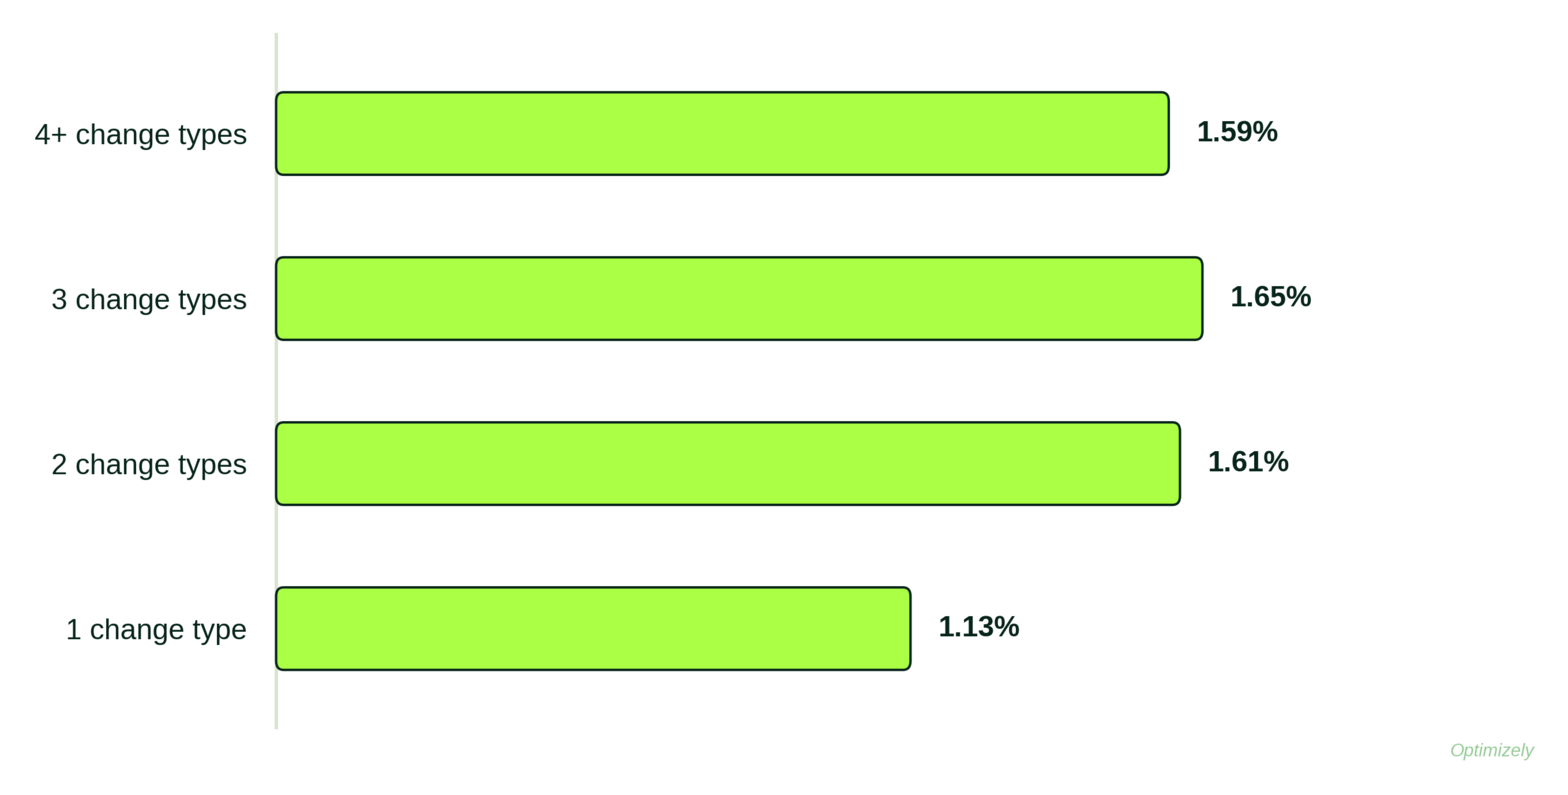
Complexity pays. Average test impact (ATI) rises with the number of distinct change types a variation combines.

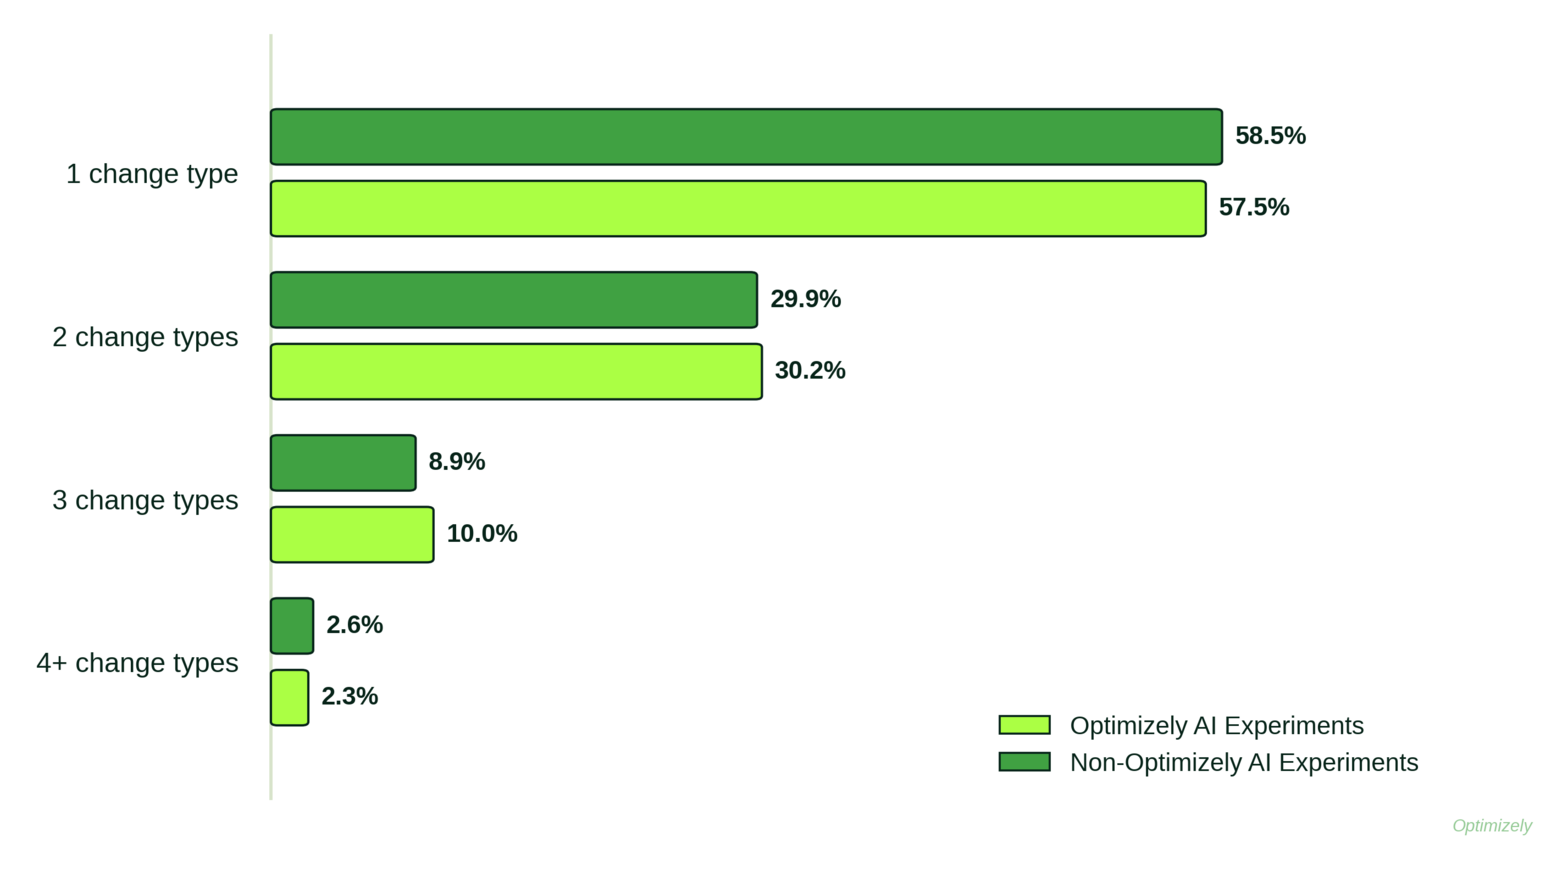
Optimizely's Web Experimentation supports seven distinct change types that can be freely combined: attributes, custom code, redirects, insert image, insert HTML, widgets, and CSS. More complex experiments show greater returns, and Optimizely AI customers build a higher share of them. 

In the year since Optimizely AI launched, customers have begun shifting towards higher complexity tests.

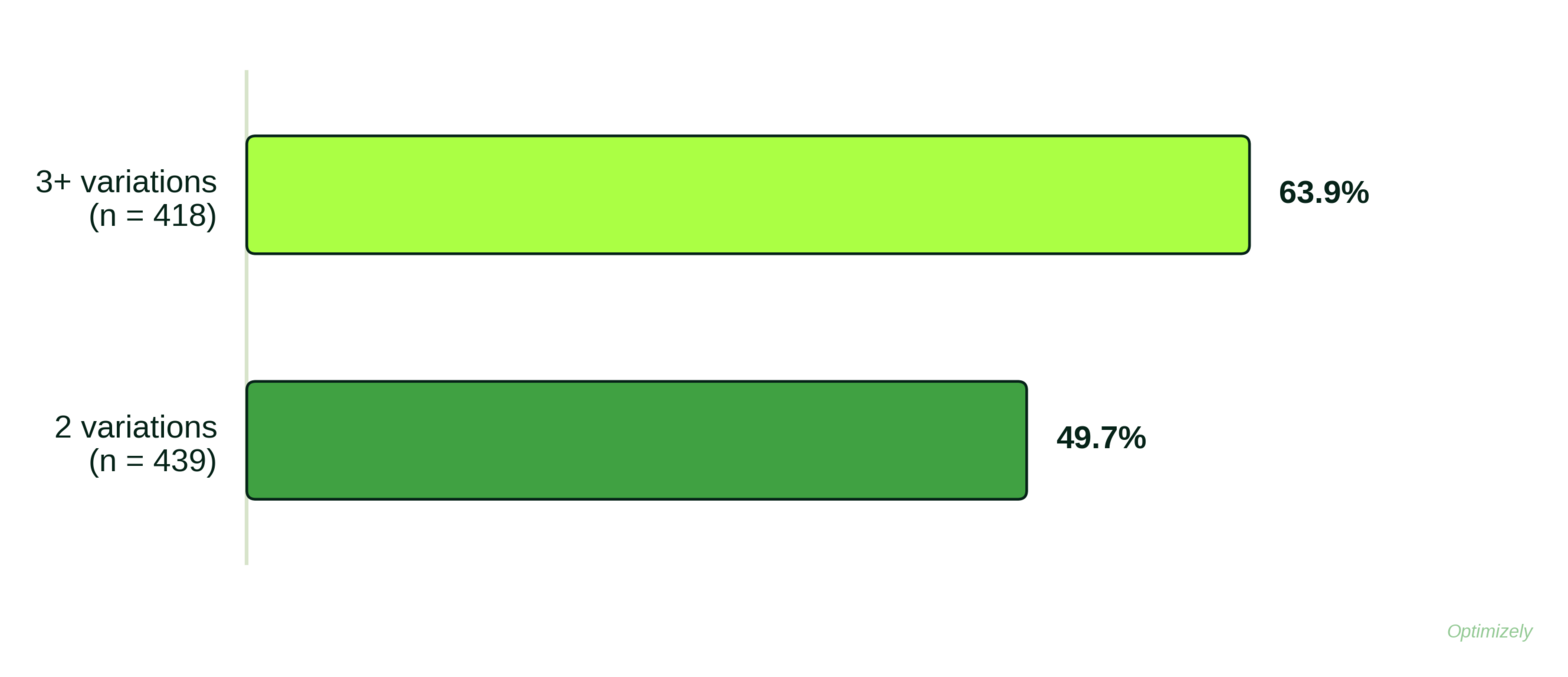
Bandits raise the ceiling and the floor if you give them options. At two variations, a bandit behaves like an A/B test: it beats an even traffic split just 49.7% of the time. With only one alternative to the baseline, there is almost nowhere for the algorithm to shift traffic. Add variations and the bandit starts working: at three or more, it beats an even split 63.9% of the time, 29% more often than at two variations.

5. Analyze 

An experiment only creates value when its result is understood and acted on. The analysis stage covers the data foundation behind experimentation: the analytics used to explore results and form the next hypothesis, and the customer data that connects tests to business outcomes.

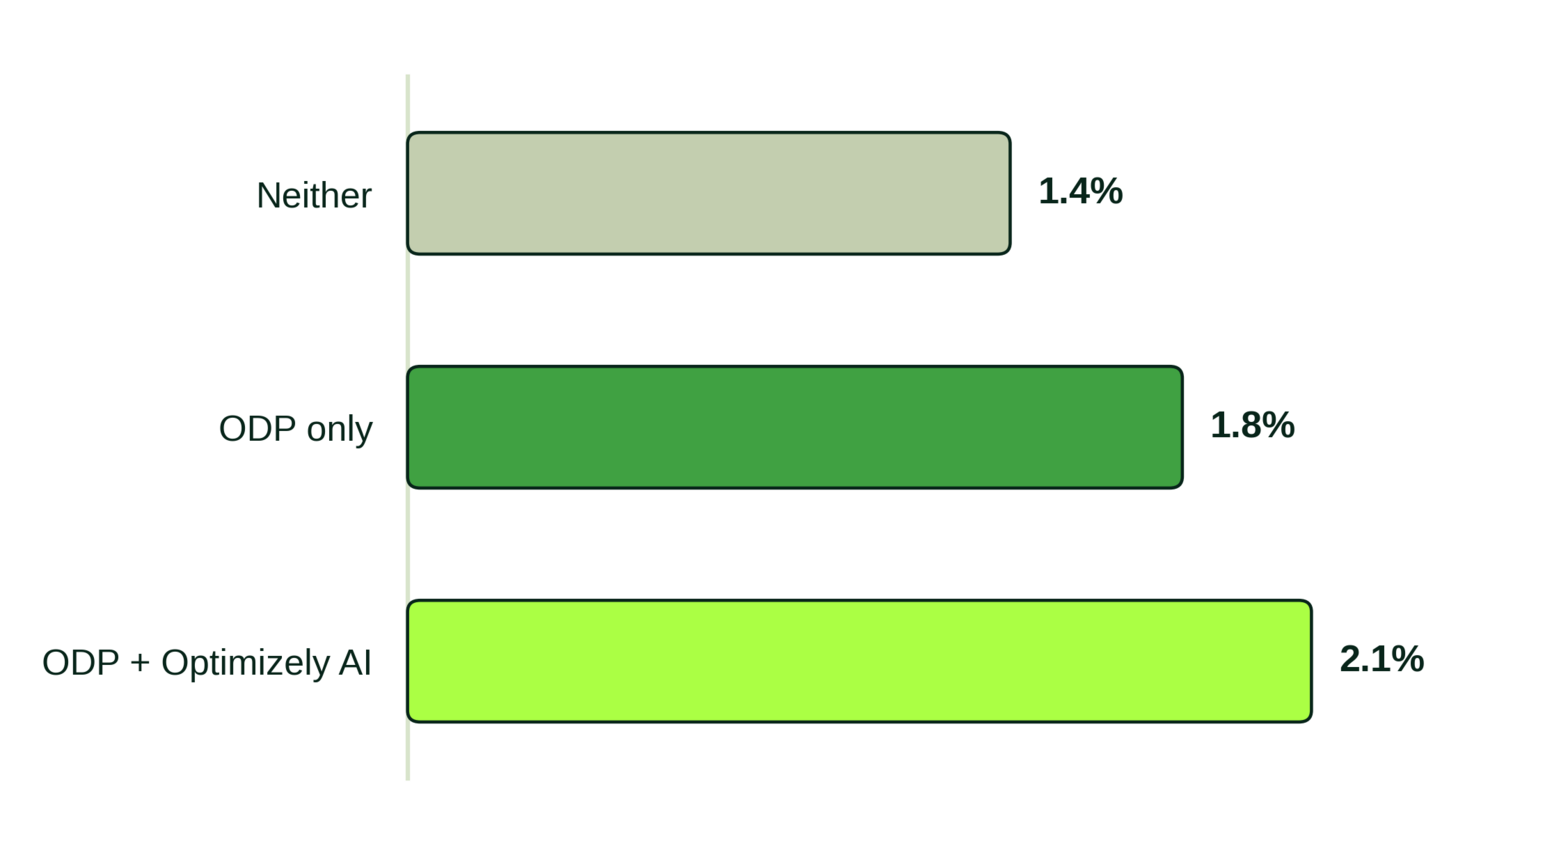
ODP customers show higher impact (ATI of 1.8% vs 1.4%) while velocity stays flat, consistent with richer customer data supporting more involved, more targeted tests.

For ODP customers who also use Optimizely AI, that trade-off disappears: they show an ATI of 2.1% alongside 29.1% higher velocity than the no-ODP baseline.

AI has changed the scale and quality at which people can experiment

The craft is the same as it always was: good ideas, set up well, built boldly, measured honestly. What AI changes is how much of that craft each team can practice.

Final takeaways from running 173K experiments: 

1

The lifecycle hasn't changed; the economy has: The best practices we identified years ago were always gated on time, traffic, and developer resources. Those gates are loosening: programs using AI show gains in both velocity and impact per test, and the gains trend upward with usage.

2

The biggest opportunities are still the neglected: The most impactful metrics remain the least tested, top-of-funnel tests still outperform the crowded bottom of the funnel, and multi-variant, complex, personalized experiments still beat simple A/B tests.  

3

Data and speed are no longer a trade-off: Stronger data foundations used to buy impact at the cost of velocity. That trade-off does not appear for ODP customers using Optimizely AI: they show a 50% higher average test impact and a 29% higher velocity than the no-ODP baseline.
 

Dive deeper into more experimentation resources: