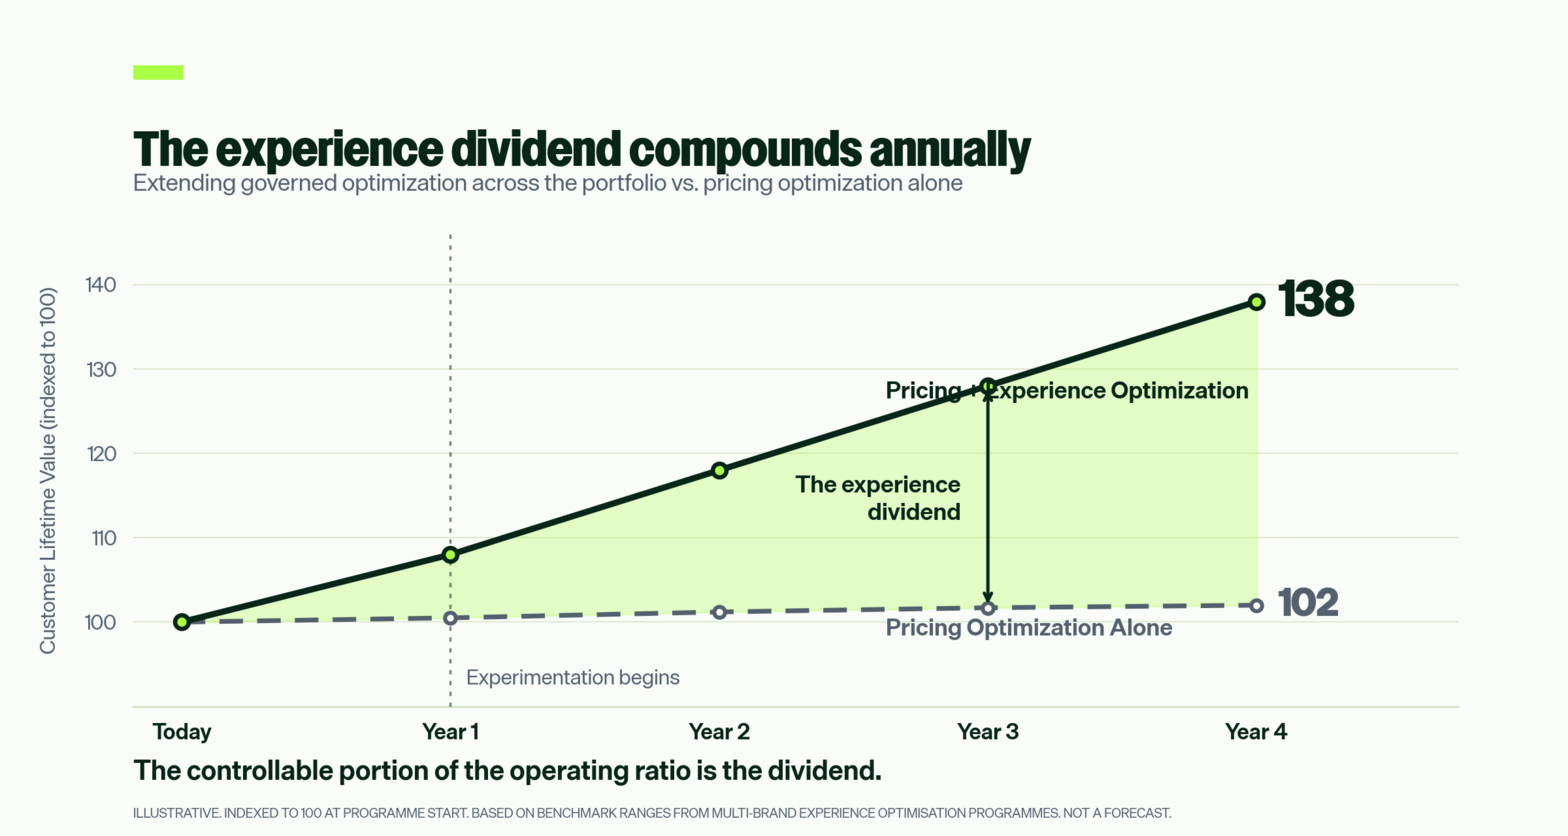
Your experimentation effort is pointed at the pricing tool, where it works. Renewals, cross-sell, self-service and the secondary brands are running on the assumptions they launched with, and the blended group ratio conceals the difference.
At your premium base, one percentage point of that ratio is worth about £24.5m.
Every figure on this page comes from your own published results.
Model your operating ratio with us:
Half a day with your team. We bring a review of your live estate across brands and journeys, and a financial model that maps four levers to the ratio. Both prepared at our cost. You bring the performance data.
You leave with the £ value of closing the gap between your best and worst performing journeys. Yours to keep.
A comparable multi-brand programme returned 15:1, with tens of thousands of additional qualified leads inside eight months.
The dividend is already sitting in your operating ratio. The only question is whether anyone is going to collect it.