Product Experimentation Pitfalls Blog Series, Post #1: The Perils of Experimenting With the Wrong Metrics
This is the first post in our Product Experimentation Pitfalls blog series written by Optimizely’s Director of Product Management, Jon Noronha. See here for more information on this 5-part series. Highlights: Measuring experiment results is relatively straightforward when you are driving toward a simple goal such as conversion. When product teams optimize for long-term or


This is the first post in our Product Experimentation Pitfalls blog series written by Optimizely’s Director of Product Management, Jon Noronha. See here for more information on this 5-part series.
Highlights:
- Measuring experiment results is relatively straightforward when you are driving toward a simple goal such as conversion.
- When product teams optimize for long-term or less well-defined goals such as long-term retention or delivering a great experience, it can be difficult to find a concrete metric that maps to a fuzzy objective.
- The solution? Choose metrics that correlate to business success, iterate on your metrics, and don’t be afraid to change course.
Experimentation is a powerful technique for making numbers go up. As long as you choose the right numbers, you’ll see transformative success. But if you choose the wrong ones, you’ll guide your product in exactly the wrong direction. Experimenting with the wrong metrics is like using a very powerful gun to shoot yourself right in the foot.
A/B testing is easy when you have a single, dead-simple conversion, like getting more leads from a landing page. It gets much harder when you’re optimizing for a subtler goal, like driving long-term retention or delivering the best user experience. Depending on the goal you choose, you can take your product in wildly different directions. For example, Airbnb and Booking.com both have strong experimentation cultures, but testing toward different metrics has led to very different user experiences:

Where teams often struggle is in linking a fuzzy objective to a concrete, measurable metric. I saw this first-hand working on Bing at Microsoft, where our team’s high-level goal was to build a great search engine that could credibly compete with Google. This is an excellent company goal, but it’s not in itself a quantifiable metric. And yet we were desperate to build a testing culture on par with Google’s, so we grasped for something measurable we could use to capture “search engine goodness” and market share in the context of an A/B test.
Our first attempt made a lot of sense in theory. To capture our quality as a search engine, we decided to measure the total number of search queries done on Bing. Surely if that number went up we’d be doing something right, because we’d have more users using our product more often. Thus we had a north star metric: we would bucket users randomly across test variations, then choose the winner by measuring total queries per unique user.

Working backwards from the goal, each step in this chain sounds logical and harmless. But in practice, it led to a slow-motion disaster.
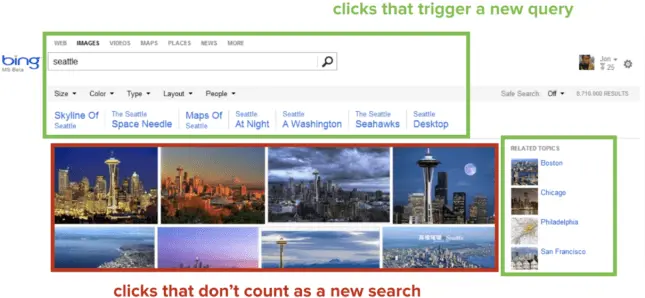
Here’s what happened: because teams were measured on driving queries per user, we started to prefer features that made you do more searches to find the same result, and penalize changes that got you to the same answer in fewer hops. For years, my team diligently tested our way to a crowded UI that put “related searches” and “try this instead” front and center, at the expense of the actual results. Each time we pushed the actual search results further away, we saw our experiments win and had a big celebration. And the effect was real: the numbers really did go up.
 There was only one snag: all this time, we weren’t actually solving the core problem. When people use a search engine, it’s because they want to find answers fast. I remember one day hearing someone at Google brag that “we’re the only site on earth that tries to get rid of you as fast possible!” Meanwhile, at Bing we were optimizing the searching instead of the finding. This was born out by qualitative research. Despite our metrics rising, our users weren’t telling us that they loved our search engine anymore. If anything, they felt more frustrated and still switched to Google.
Eventually, after much soul-searching, this feedback led us to realign our entire experimentation program. On further analysis, we realized we’d chosen precisely the wrong metric, so we changed gears. Going forward, we set a goal of reducing queries per session and instead of optimizing for sessions per user.

As the leader of Microsoft’s experimentation platform, Ronny Kohavi, explained in an article for the Harvard Business Review:
Arriving at an OEC [Overall Evaluation Criteria] isn’t straightforward, as Bing’s experience shows. Its key long-term goals are increasing its share of search-engine queries and its ad revenue. Interestingly, decreasing the relevance of search results will cause users to issue more queries (thus increasing query share) and click more on ads (thus increasing revenue). Obviously, such gains would only be short-lived, because people would eventually switch to other search engines. So which short-term metrics do predict long-term improvements to query share and revenue? In their discussion of the OEC, Bing’s executives and data analysts decided that they wanted to minimize the number of user queries for each task or session and maximize the number of tasks or sessions that users conducted.
When users love your search engine, they visit a lot and leave as quickly as possible because they consistently find what they’re looking for. While the first metric sounded right, only this second version captured the real impact that mattered. And not coincidentally, Bing now has a thriving culture of experimentation and reported its first quarterly profits in late 2015.

The solution
As you design your product experiments, think carefully about which metrics you use. When in doubt, ask yourself one question: if this metric went up and everything else stayed flat, would you be happy? This can help you choose a metric that correlates to business success, not just one that’s easy to move. Another way of framing it is: what bad behavior could this metric incentivize? Or alternatively: if my users found out this was the behavior I was trying to push them toward, how would they react?
Don’t be afraid to re-evaluate these metrics periodically, because you’ll never get it perfectly right the first time. While it sounds like heresy in a data-driven profession, trust your gut! If it feels like metrics are leading you the wrong way, rethink the metrics and take the time to choose the right goal. Otherwise, experimentation will lead you right off a cliff.
Key takeaways
To avoid experimenting on the wrong metrics:
- Choose metrics that correlate with business success, not just metrics that are easy to move.
- Don’t be afraid to re-evaluate metrics frequently and iterate into metrics that work for your team.
- When it feels like metrics are leading you astray, trust your gut and rethink your metrics strategy. Taking more time to choose the right goal up front will save time in the long term.
For more on Bing’s experimentation journey, I recommend the team’s paper on Seven Pitfalls to Avoid when running online experiments. It’s full of candid lessons like this one for building a successful culture of experimentation. You can also find more tips from Optimizely on improving metrics that matter.
About the author

