When could you use ratio metrics for A/B testing and experimentation?
Ratio metrics are particularly powerful when you want to customize your metric with a different denominator than what's typically used in simple metrics.
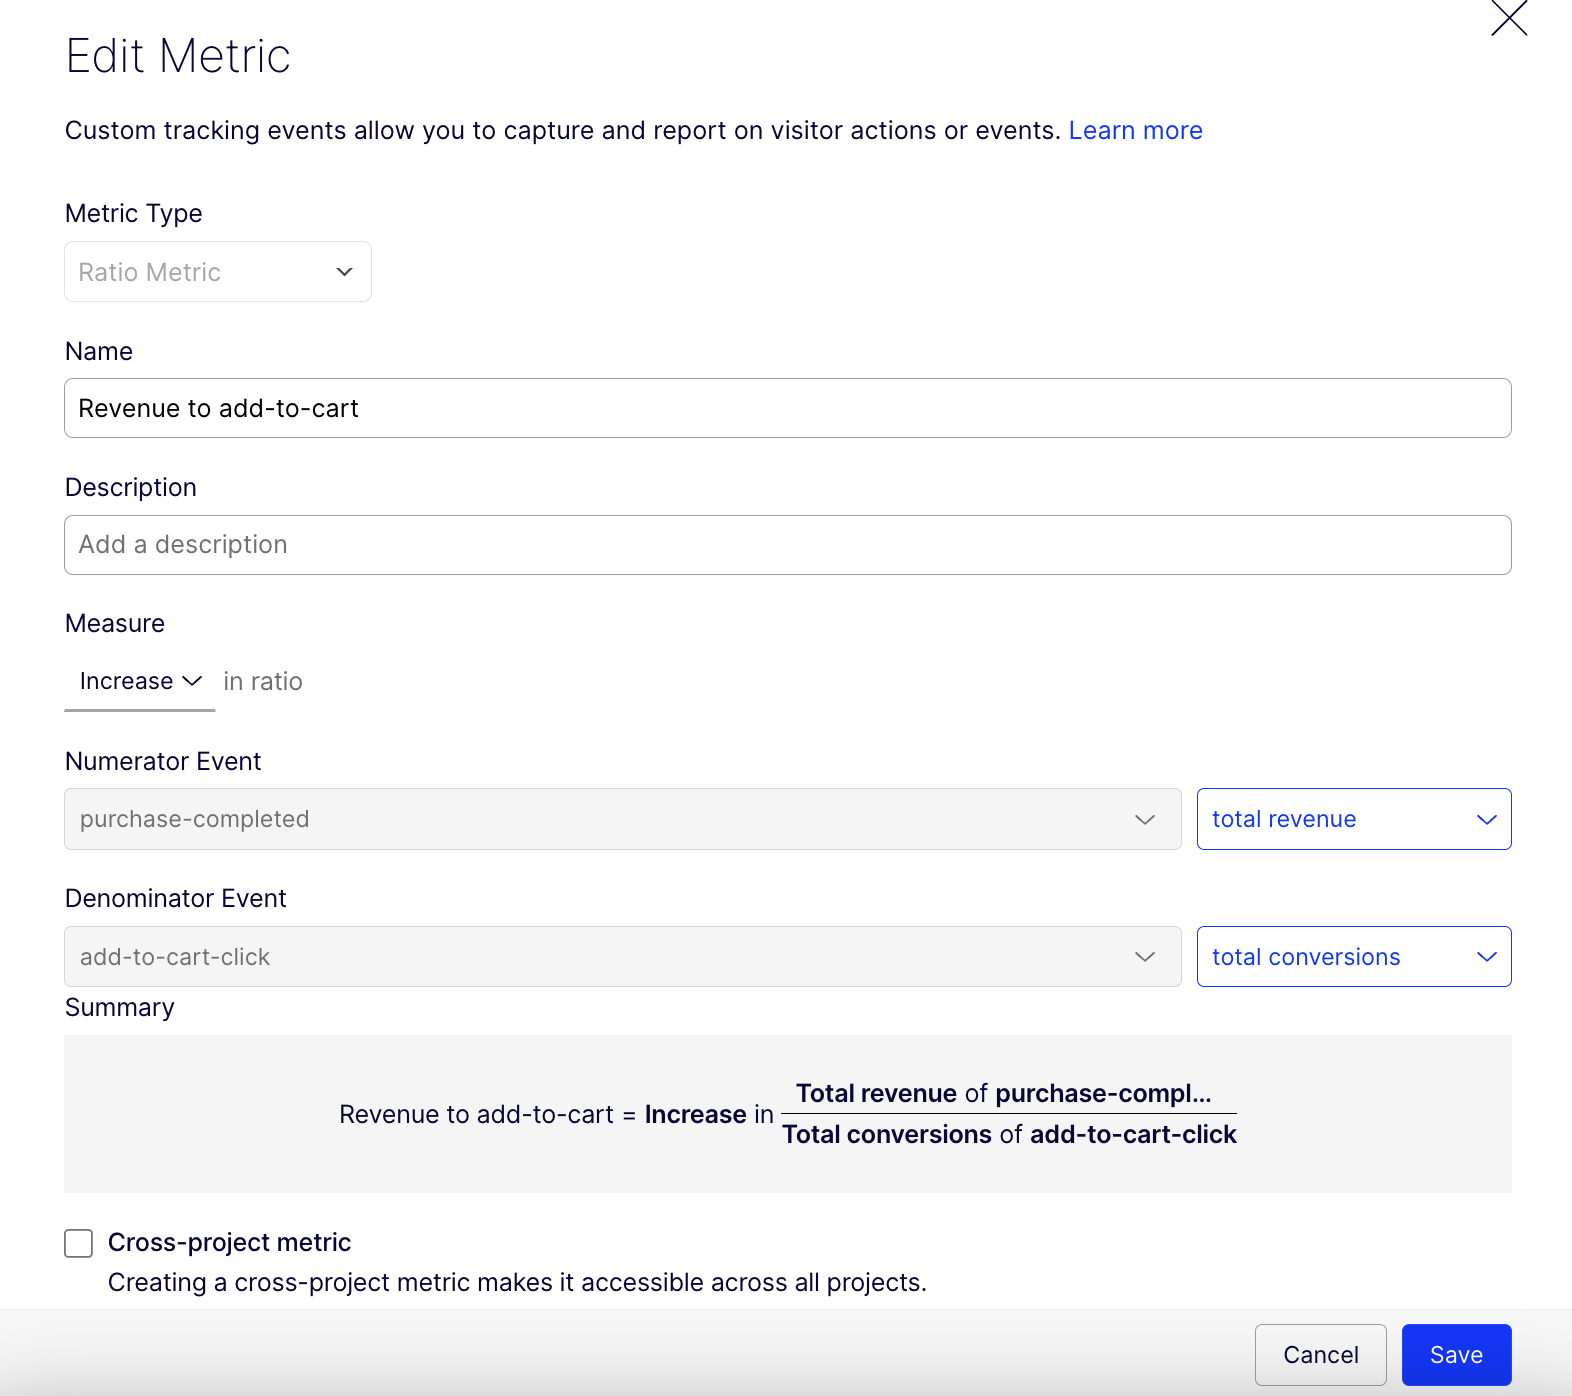
For example, instead of tracking revenue per user (a simple metric), you might want to assign your revenue to add-to-cart clicks. This ratio metric "revenue per add-to-cart click" allows you to measure the efficiency of your cart additions in generating revenue.
You can also track average watch time per account. Instead of per user, which helps subscription-based streaming services understand engagement at the household level.
Other examples:
- E-commerce product optimization: Instead of tracking simple revenue per user, measure Revenue per Add-to-Cart Click (Revenue / Add-to-Cart Clicks). This ratio metric helps you understand if your product page improvements are driving higher-value purchases when users engage, even if click rates remain stable.
- B2B SaaS platform: For enterprise software with multiple users per company, track Feature Adoption per Account(Total Feature Uses / Number of Accounts) rather than per user. This helps you understand organizational adoption patterns rather than individual usage.
- Streaming service content strategy: Instead of measuring watch time per user, track Total Watch Time per Household Account (Total Minutes Watched / Number of Accounts). This ratio metric provides insights into content engagement at the subscription level, which directly impacts retention.
Over all, ratio metrics allow you to construct measurements that better align with how your business evaluates performance, bridging the gap between experimentation data and your established KPIs.
Creating funnel-like metrics
When connection and order of events are important...
Because Optimizely calculates ratio metrics on a per-unit level, it's also possible to use them when analyzing the connection between two sequential events.
For instance, you can create a ratio metric that measures the percentage of users who submit a form (numerator event) after clicking on a promotional banner (denominator event). This creates something similar to a "funnel metric" by having count-type events in both the numerator and denominator.
This approach helps you assess conversion efficiency at specific touchpoints - like how effectively your promotional elements drive desired actions. You gain insights into the conditional relationship between these connected events, something a simple metric (such as total form submissions) wouldn't reveal.
However, it's important to remember that this application, while useful in specific scenarios, is secondary to the main purpose of ratio metrics: creating flexible measurements that align with your established business KPIs.
Wrapping up...
Ratio metrics provide valuable flexibility in your experimentation program by allowing you to construct measurements that directly align with the KPIs your business already uses. This alignment bridges the gap between experimentation data and the metrics your stakeholders care about most.
Remember these key principles when working with ratio metrics:
- Choose metrics that align with your established business objectives and KPIs
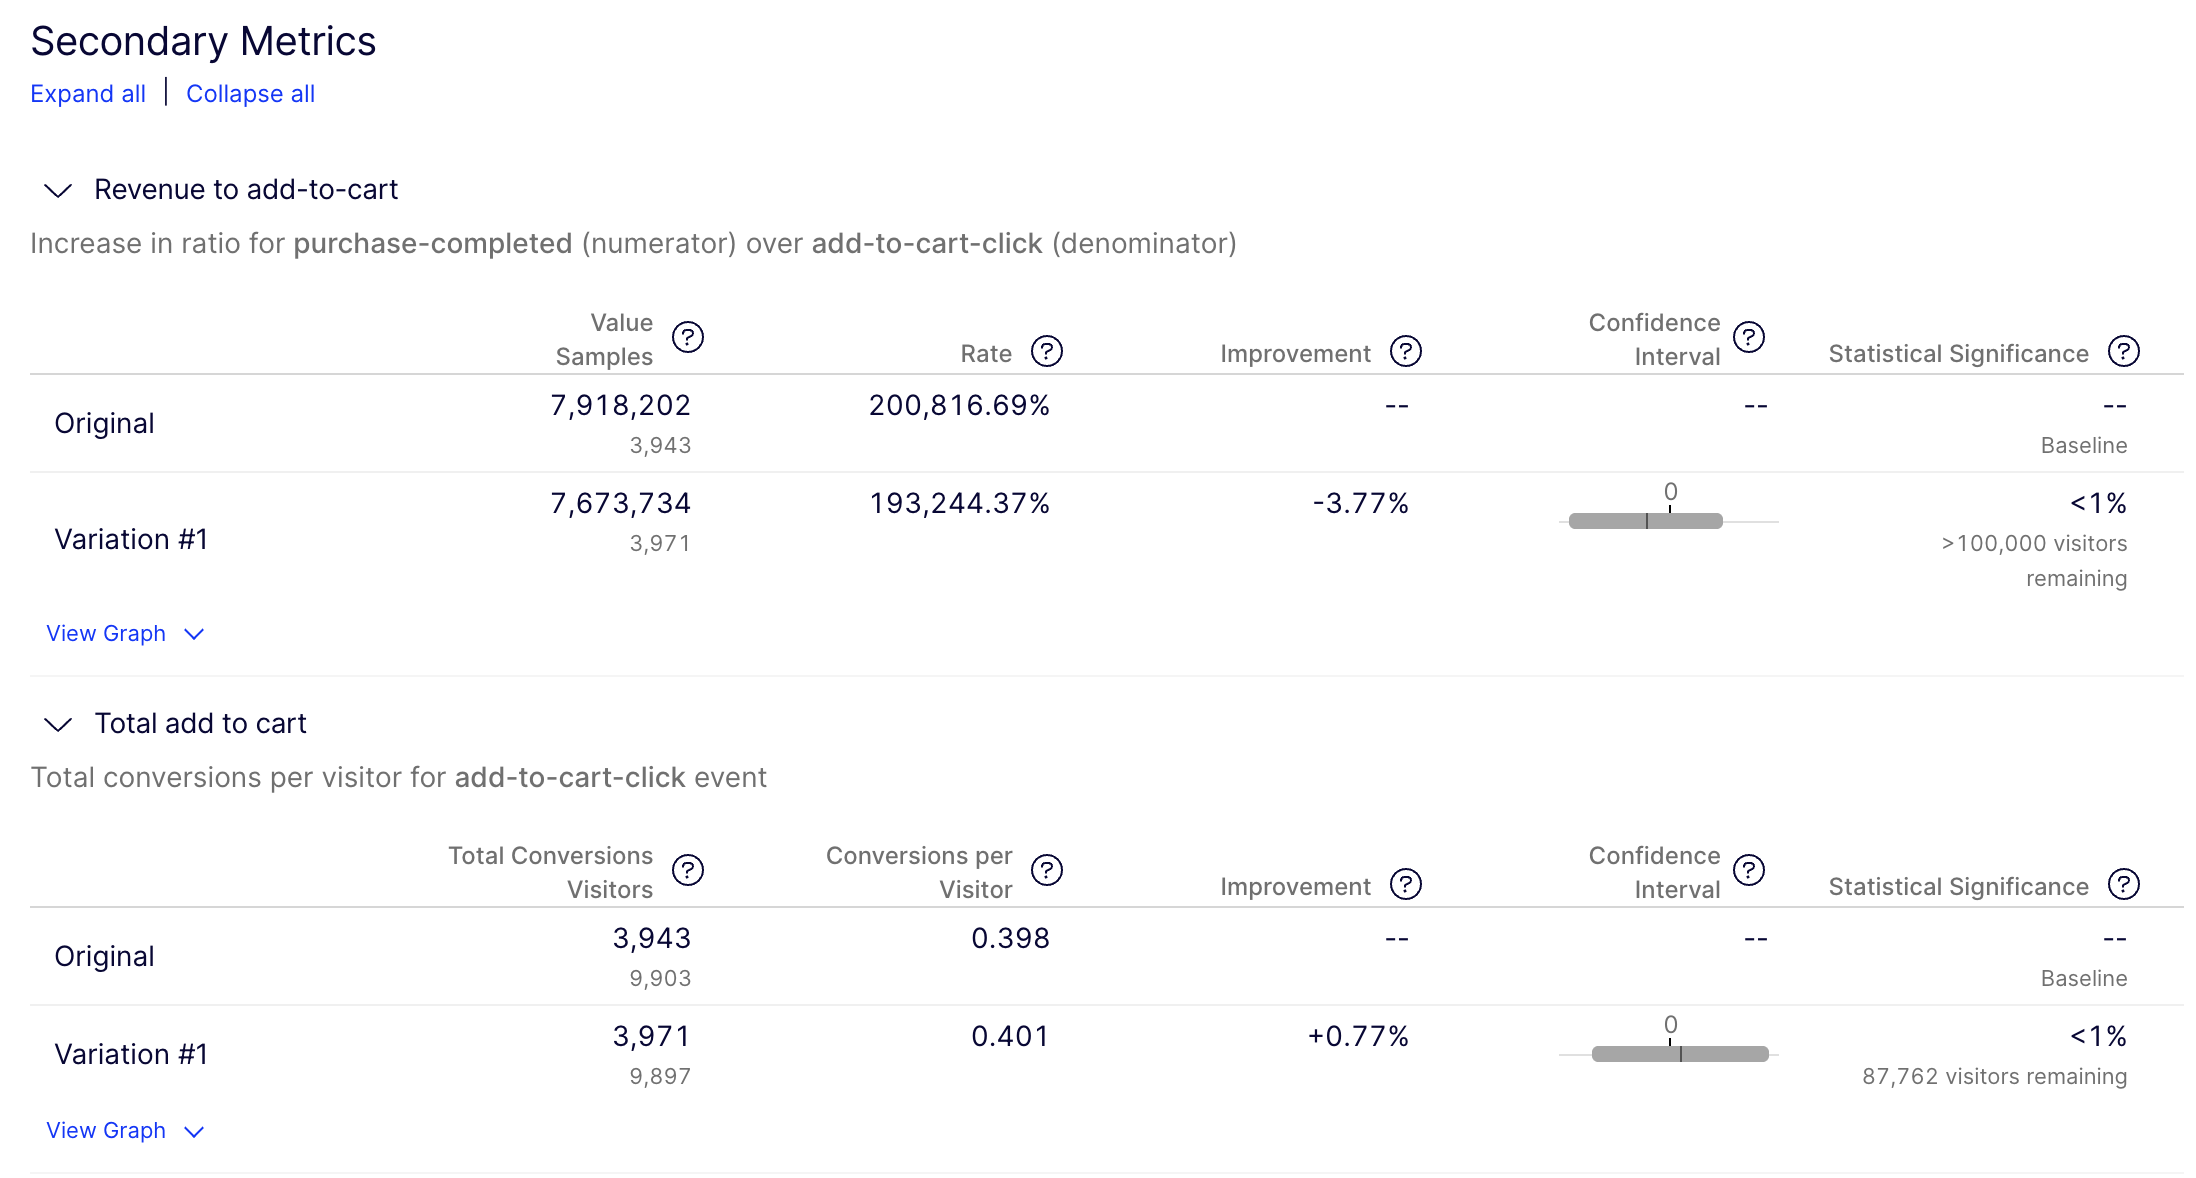
- Always examine the component metrics (numerator and denominator) for complete context
- Use the statistical capabilities of platforms like Optimizely to ensure reliable results
The most successful experimentation programs strategically select between simple and ratio metrics. Simple metrics offer clear, trustworthy data on individual events, while ratio metrics provide the flexibility to align with your organization's established KPIs.
Choosing the right metric type creates a measurement approach that connects your experiment results directly to metrics that drive business decisions.