Connect directly to your data warehouse for trustworthy insights that prove your impact and put an end to all the debates.

Product managers
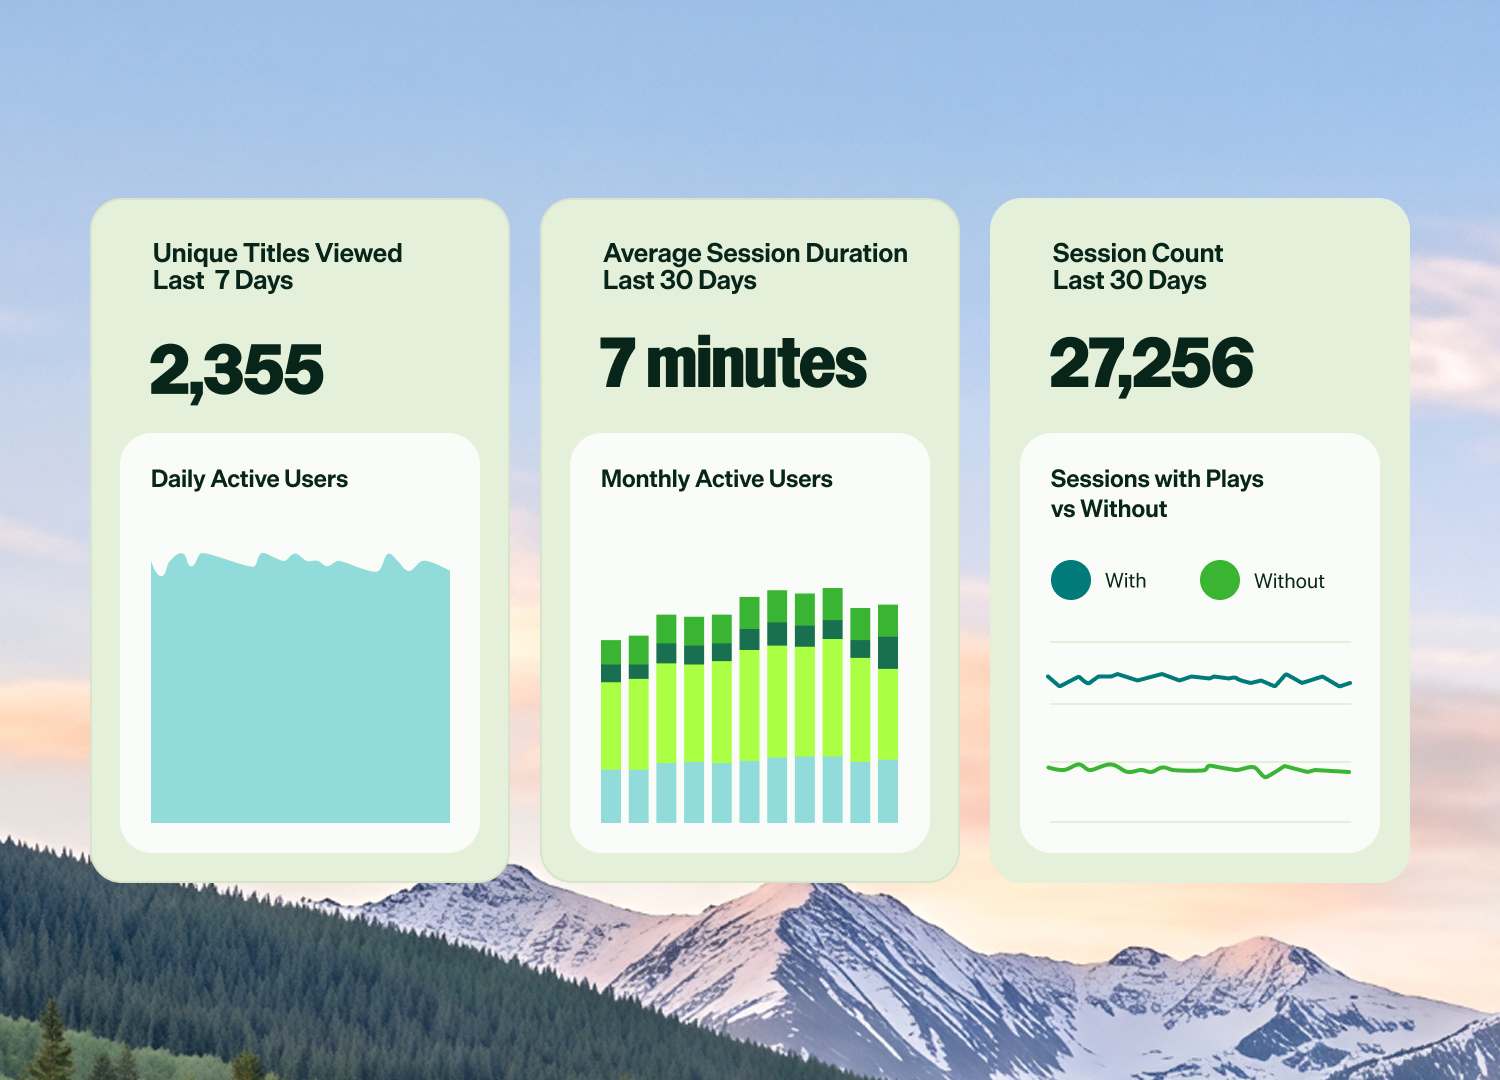
Instantly measure feature adoption, retention, and the impact of new releases.
Connect directly to your data warehouse for trustworthy insights that prove your impact and put an end to all the debates.
Trusted by 10,000+ brands
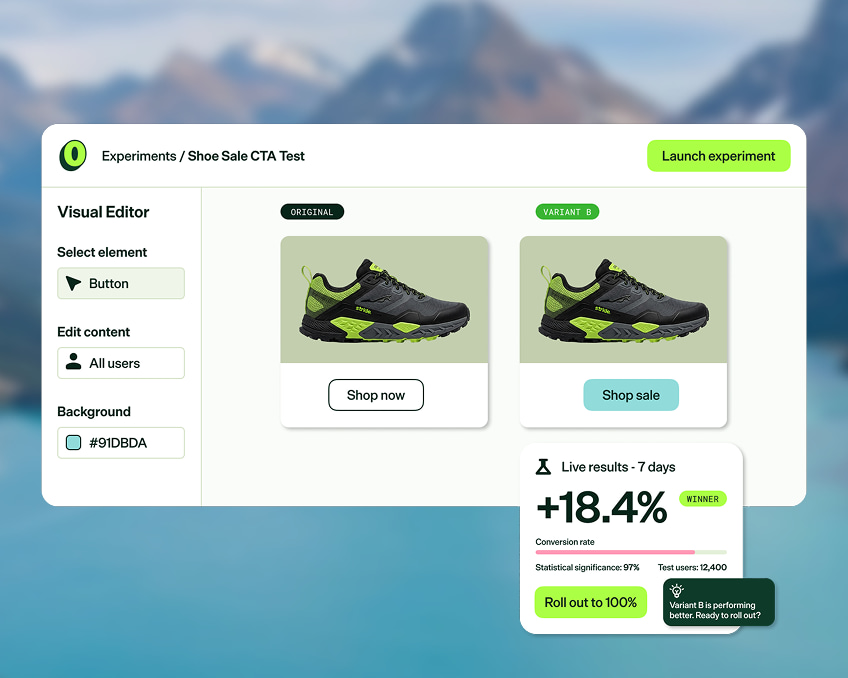
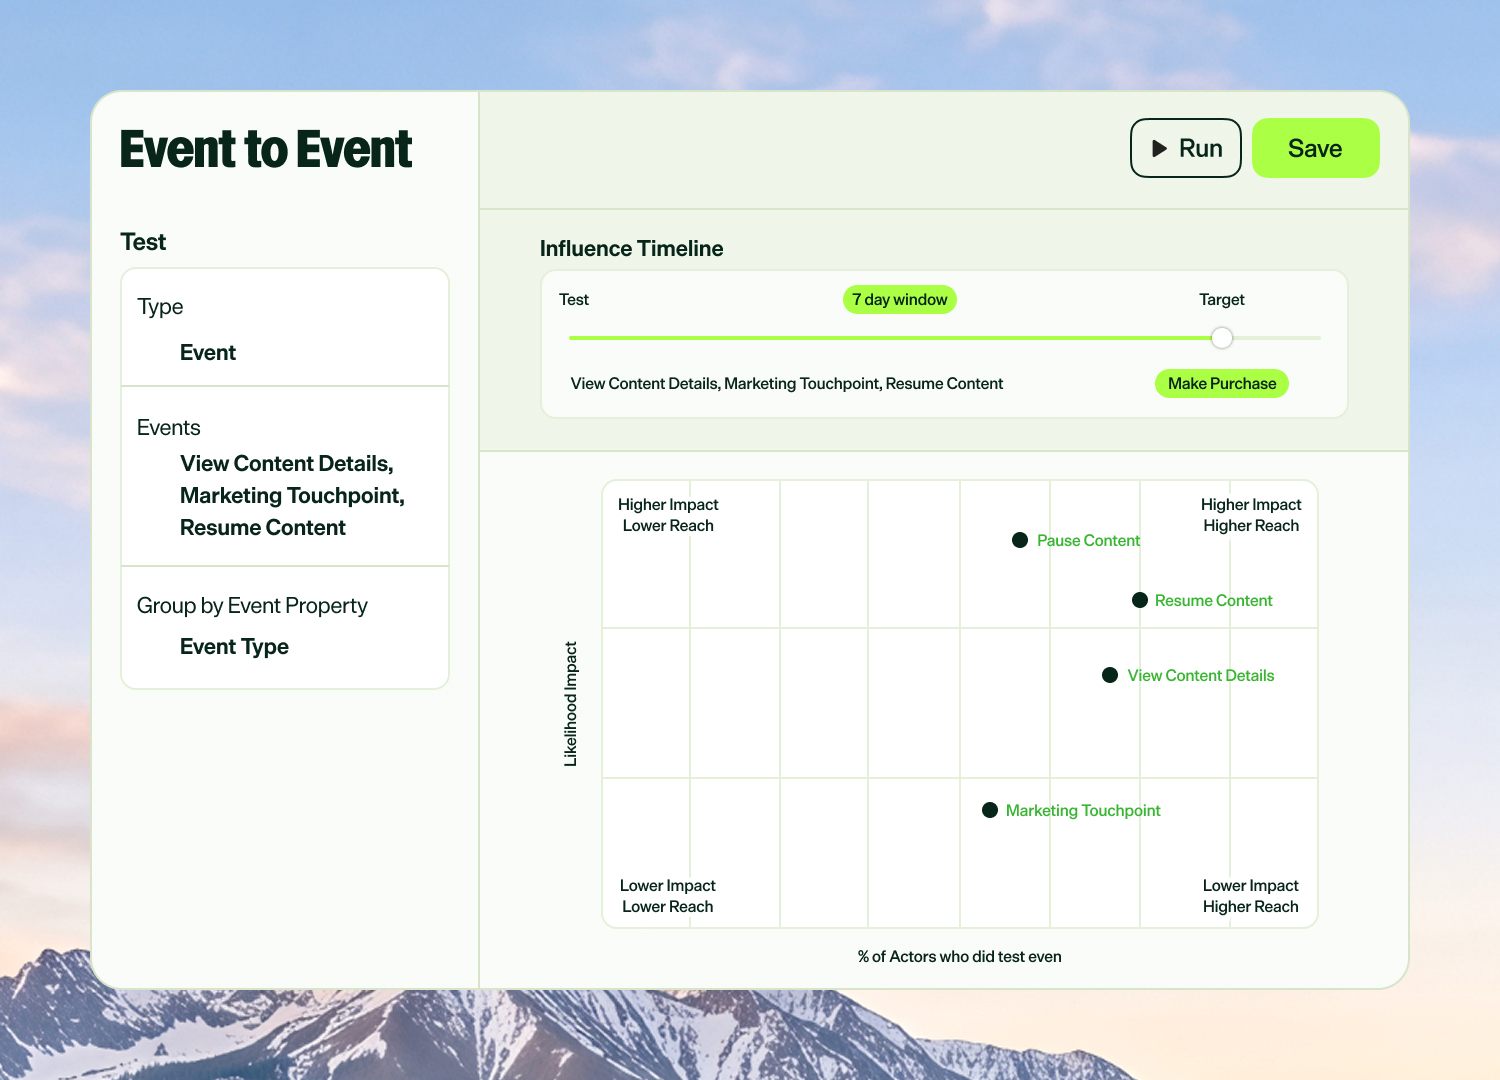
Stats Engine-powered A/B tests and feature flags give you results you can trust, with agents that surface what's moving the needle so you're not digging through dashboards to find it.
Connected for business impact
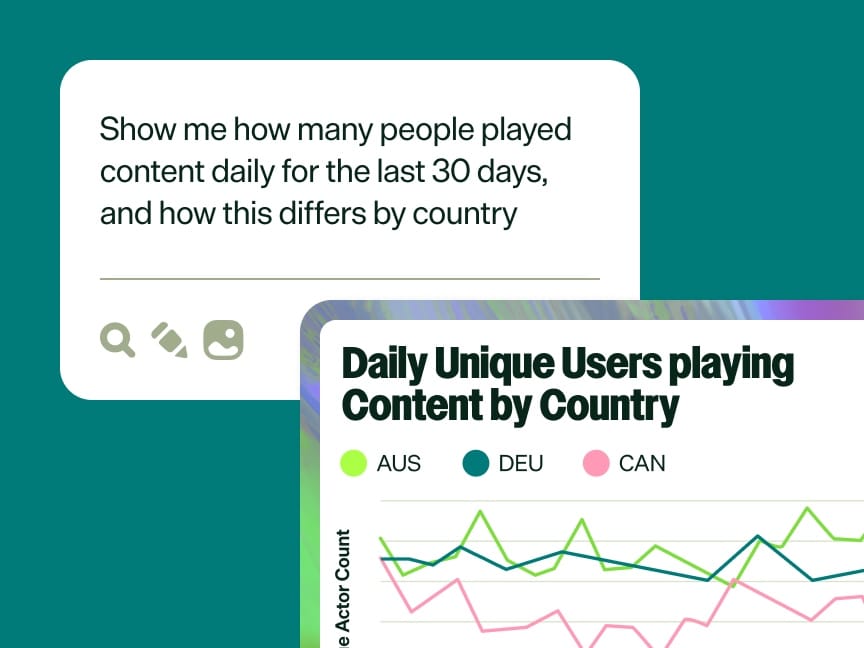
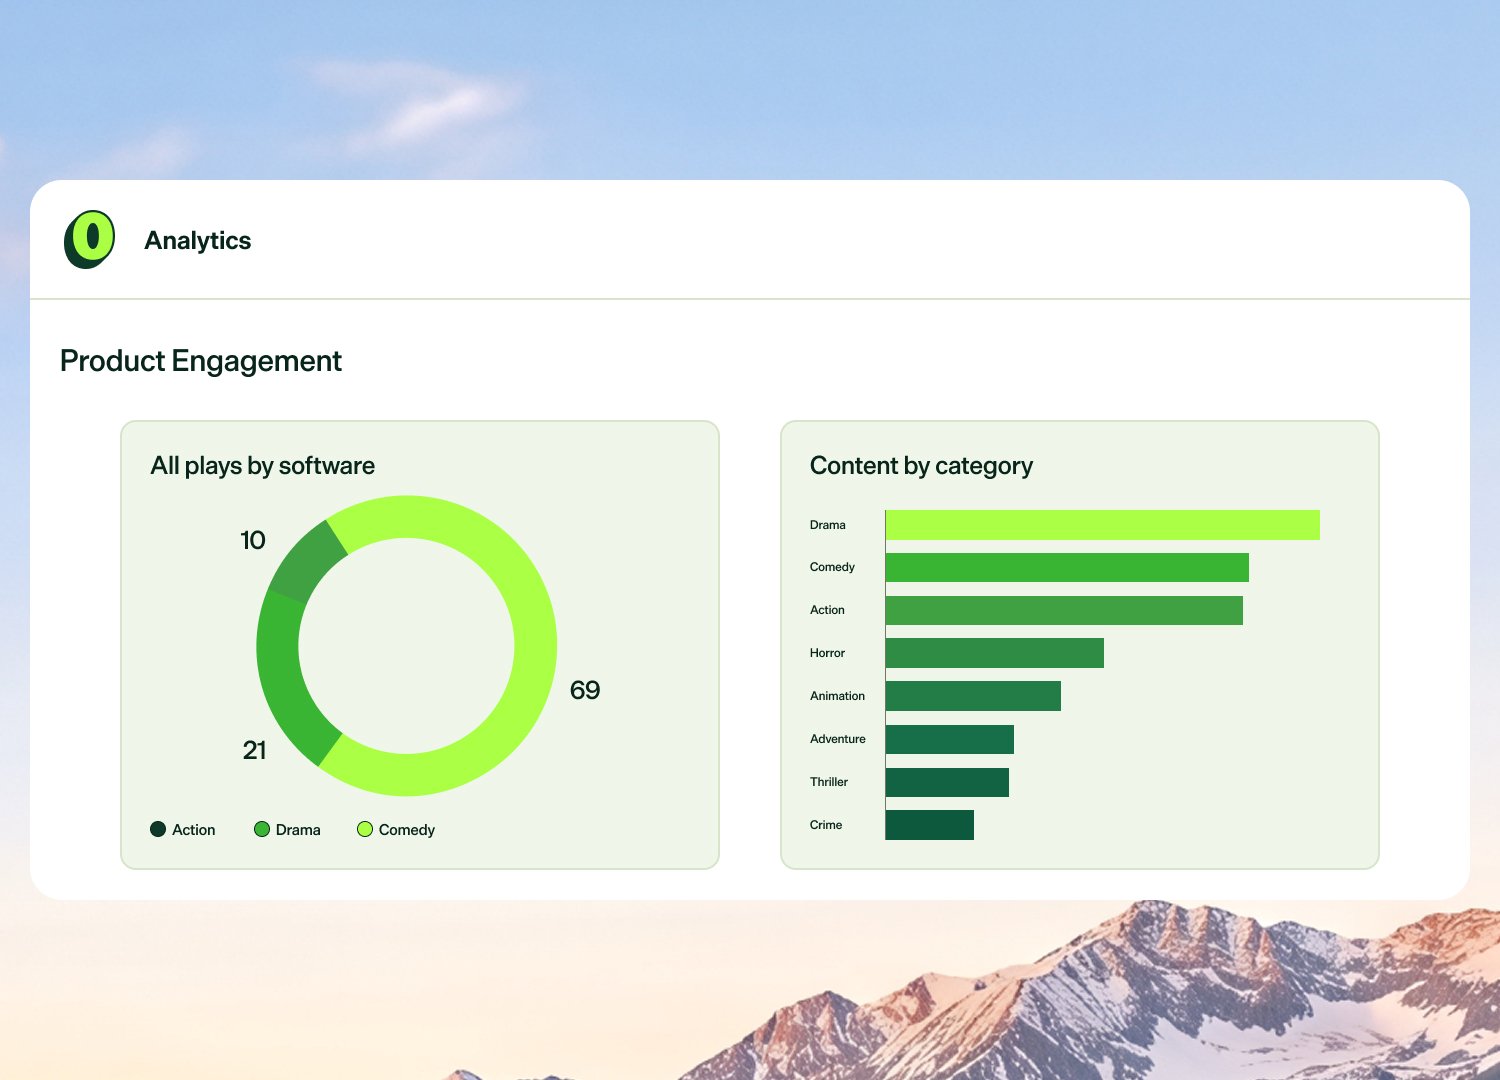
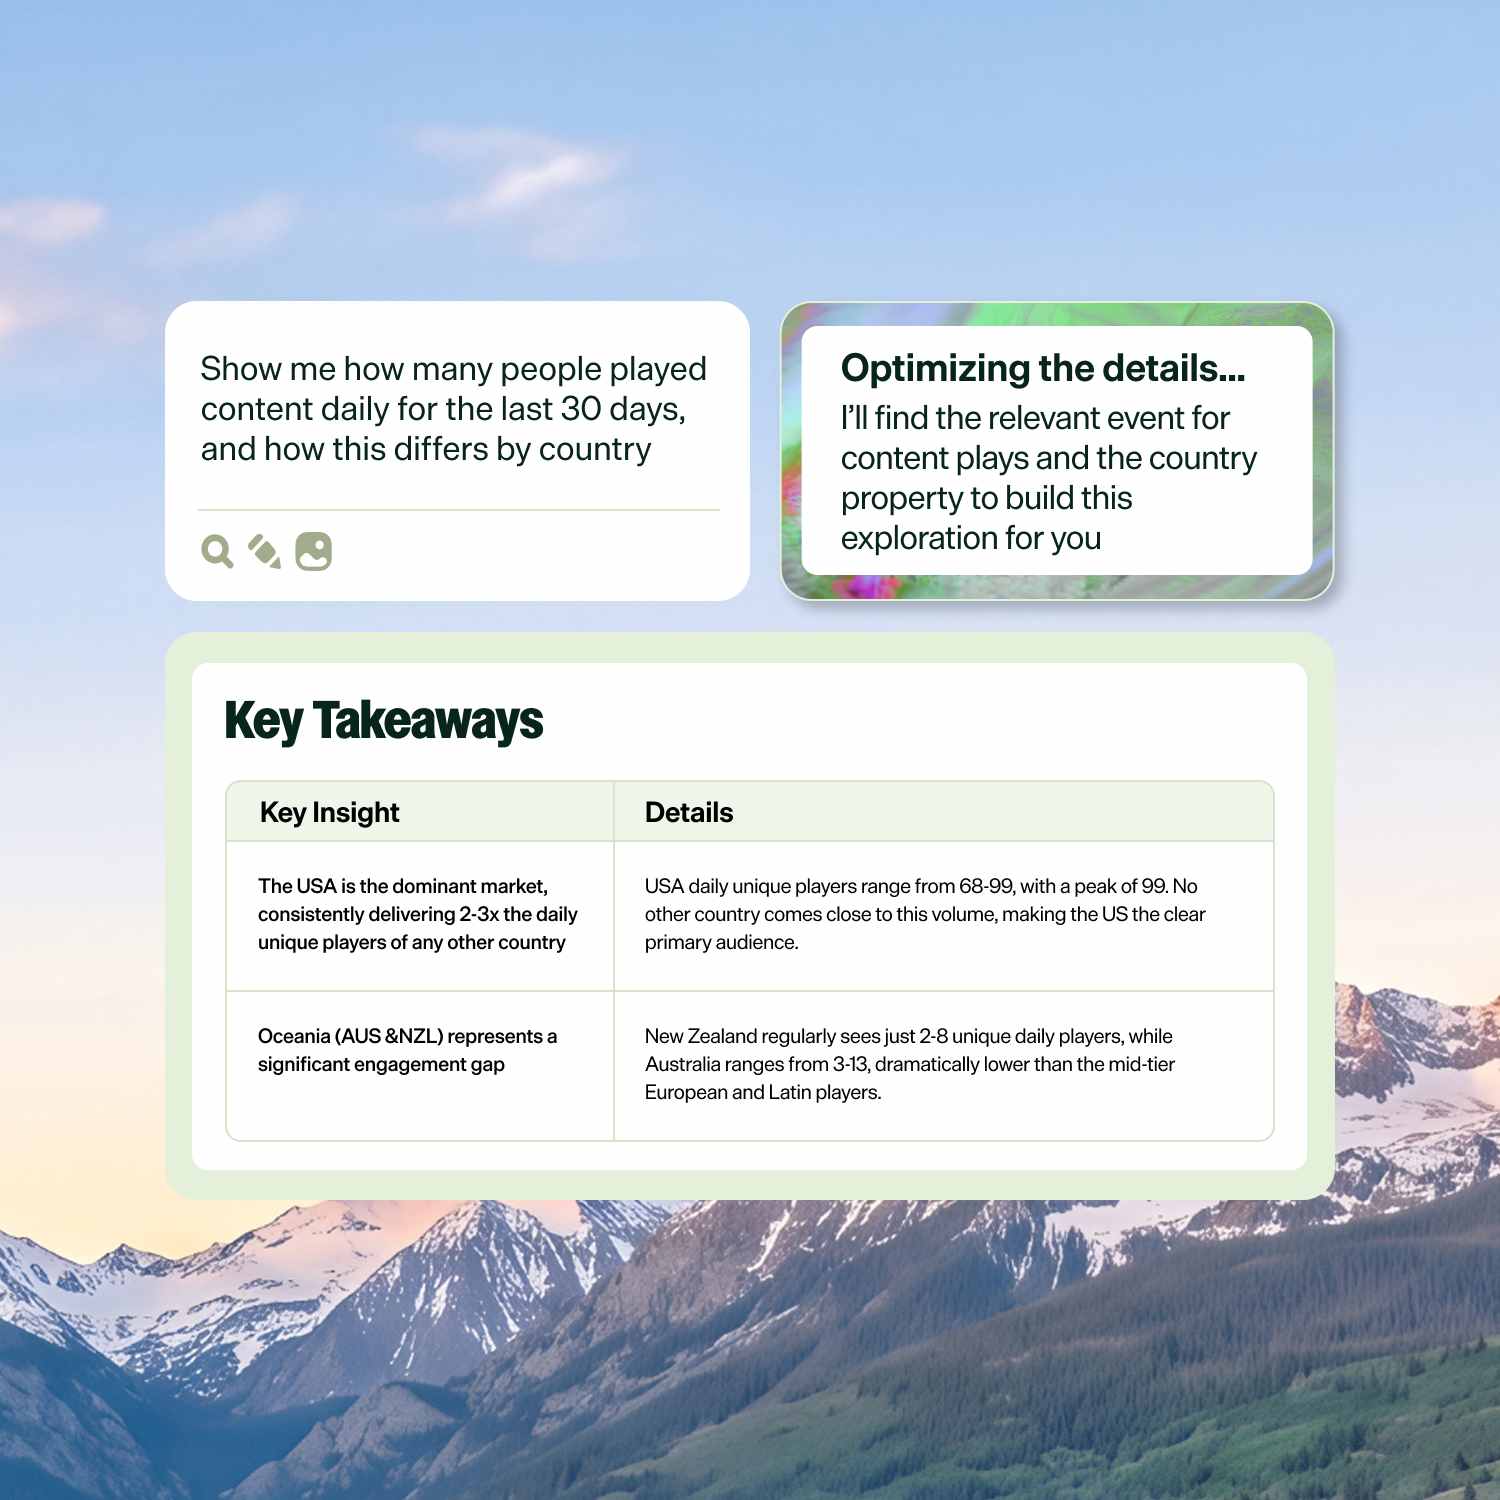
See exactly where users drop off, which journeys convert, and which segments are worth your attention. No SQL, no data team, no waiting.
Don’t wait for developers
Something breaks in production? Disable the flag from the dashboard. No redeploy. No incident at 2am. Features go dark in seconds, not hours.
Metrics built around your business
Define any metric your business needs, from simple counts to complex models, and let agents flag when something shifts before you have to ask.
Instantly measure feature adoption, retention, and the impact of new releases.

End ad-hoc requests and empower business teams with self-serve analytics, so you can focus on strategy.

Prove your ROI by connecting campaigns to revenue and LTV across the full customer journey.
Optimizely Analytics connects your warehouse, your experiments, and your customer data into one source of truth. So your team moves faster on what actually matters.
Analytics connects directly to your cloud warehouse for faster answers, less duplication, and none of the inconsistency that slows teams down.
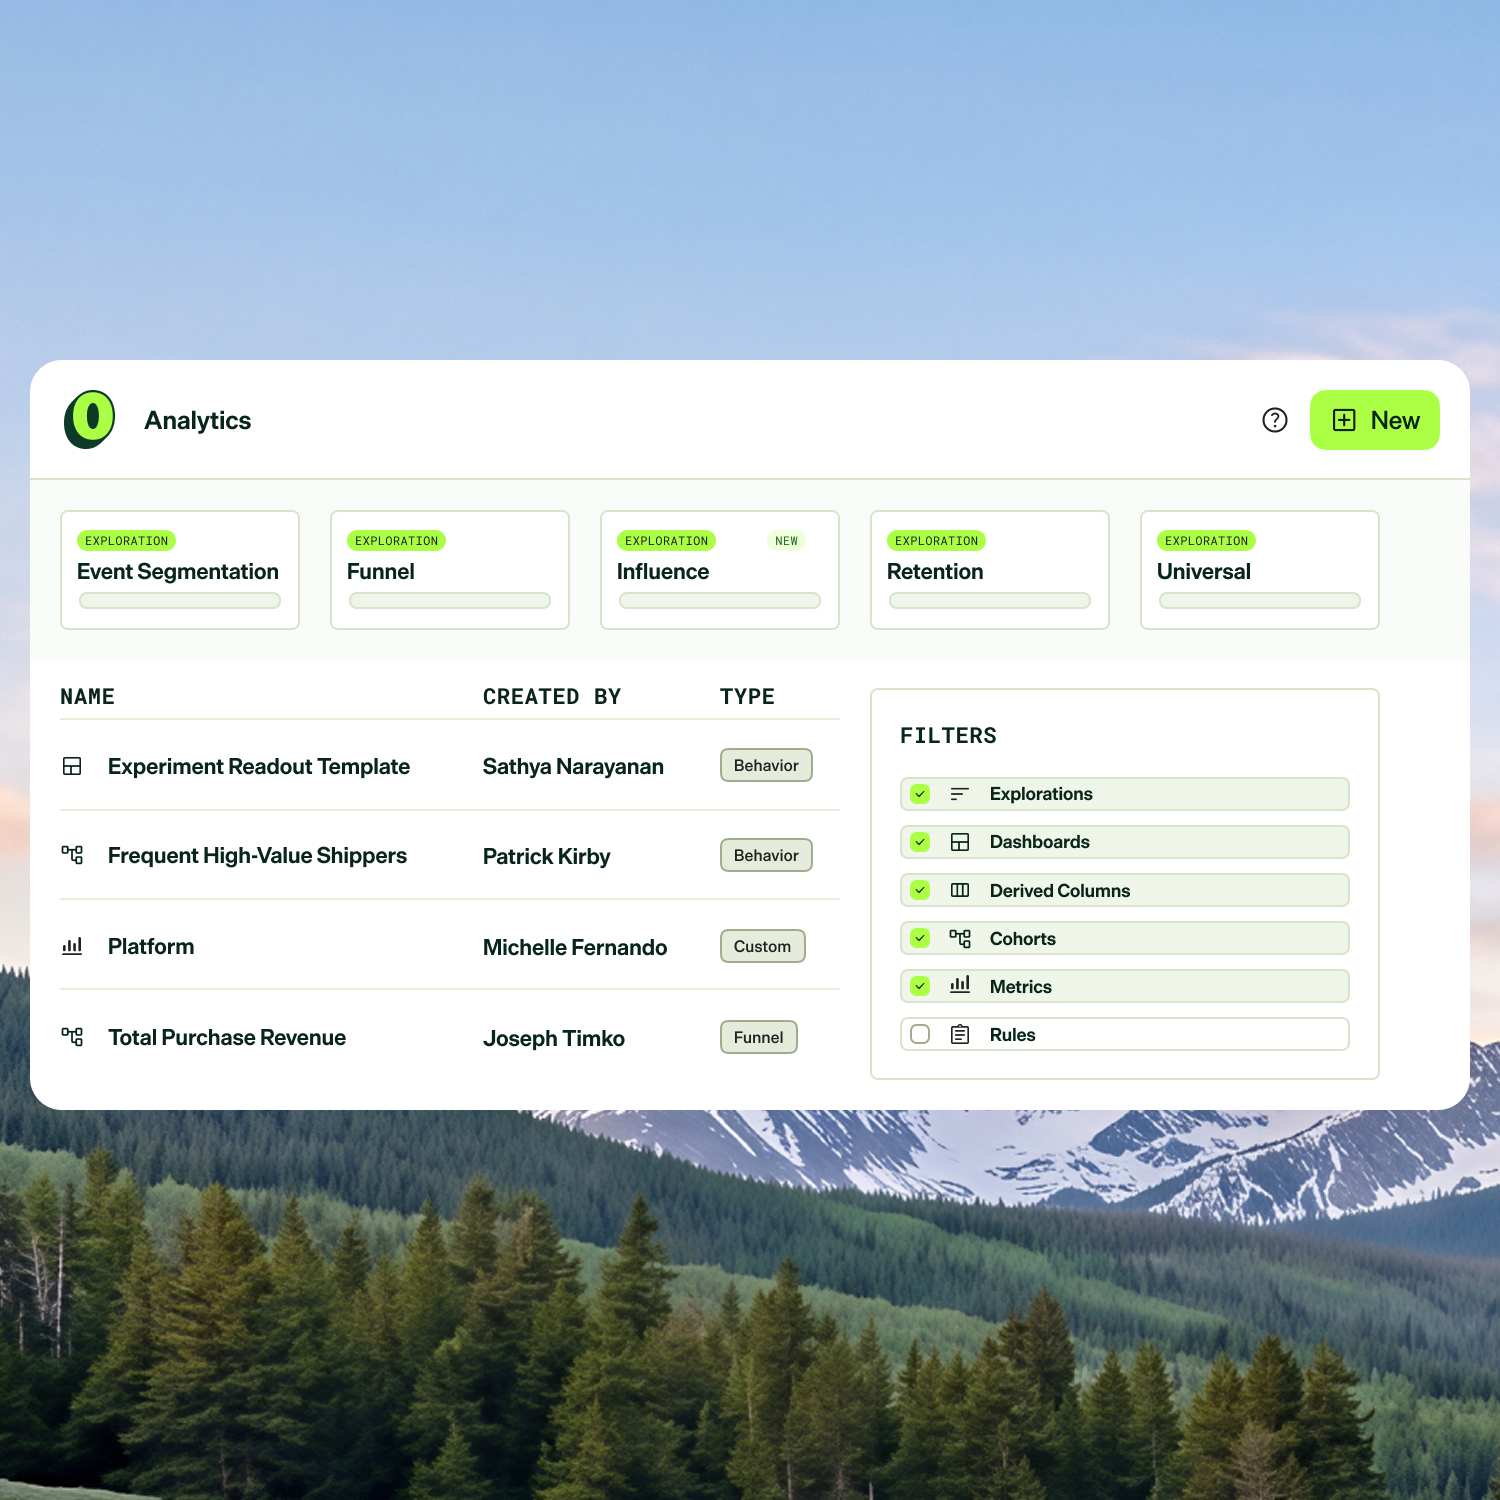
Build models, dashboards, and visualizations without SQL or data team dependencies. Decisions move faster and reporting backlogs shrink.
Analytics connects directly to your cloud warehouse for faster answers, less duplication, and none of the inconsistency that slows teams down.
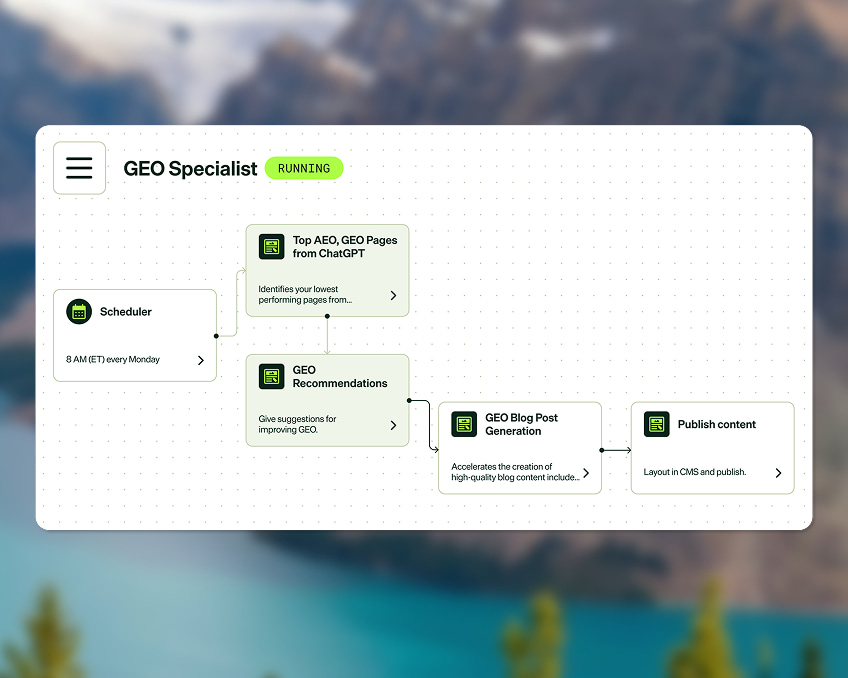
We’ve got a whole library of pre-built AI agents to help you analyze. Use as they are or create your own agent specific to your team’s content needs.
Explore all agents
Get up and running in hours with pre-built, secure connectors to leading data warehouse.


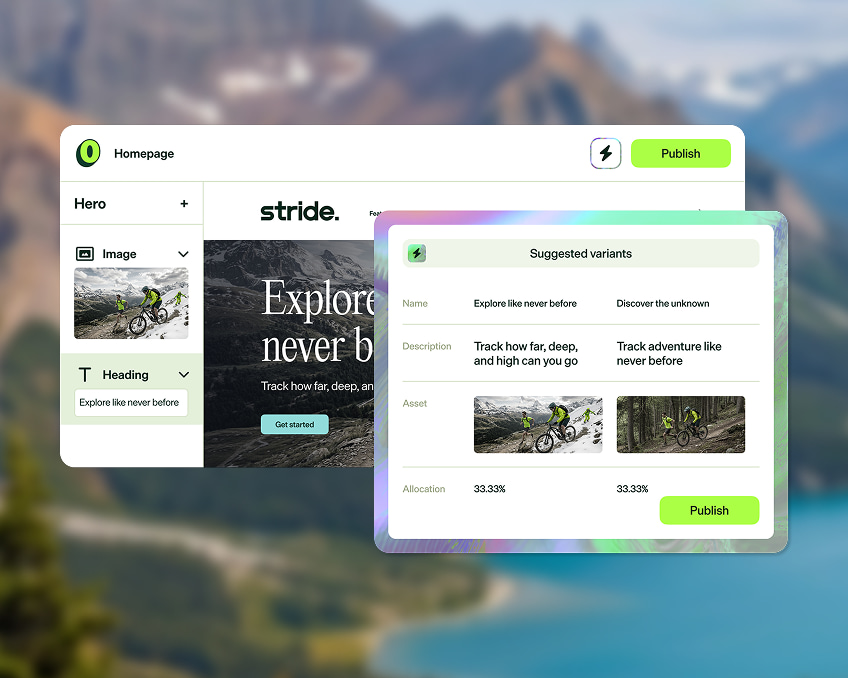
Bring your features to life with tools for content creation, optimization, and AI orchestration.