A.R. Tabrizi
Optimization Manager, Demand Media, eHow
Today, online publishers like eHow have to balance the demands of two very different (and very important) stakeholders: advertisers and content consumers. Offering a great experience to both is critical – but can also be a tremendous challenge. Testing, iterating, and optimizing ad viewability is the way today’s most successful publishers are working toward that goal.
It’s essential for any publisher to care about viewability and pay attention to this metric.
— A.R. Tabrizi, Optimization Manager, Demand Media
Ad viewability is the concept of how visible ads on a website or mobile app are to users. This key metric can make or break the amount of ad revenue a publisher brings in. Optimizing ad viewability can help publishers increase the value of their display inventory and maximize ad revenue.
eHow uses Optimizely’s Moat integration ensure high viewability rates for their ads. Using the integration, the eHow team builds A/B tests where they experiment with different page layouts and designs, tracking the impact each change has on ad views to ensure the highest levels of viewability, performance, and ROI for digital ad campaigns and content.
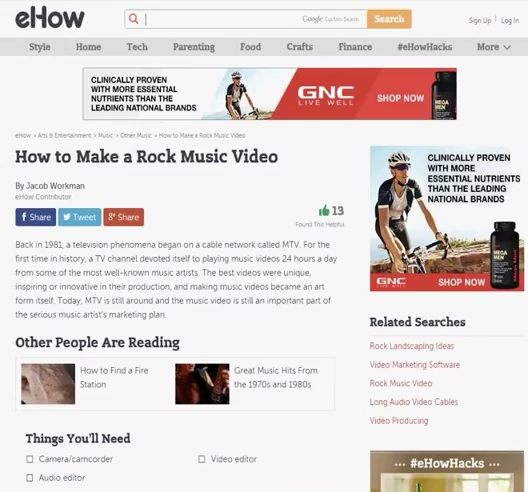
The following example is a test eHow recently ran to improve ad viewability on its website.
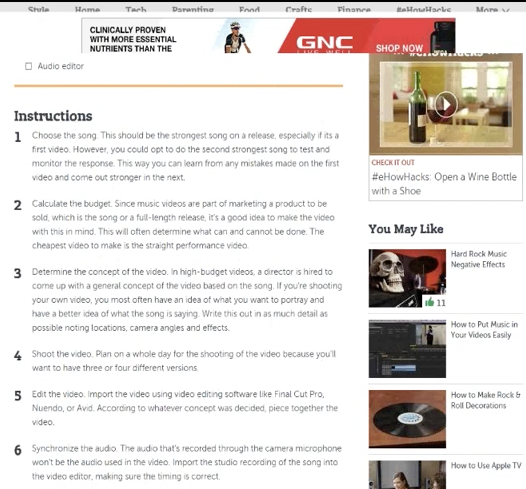
eHow was experiencing low viewability metrics for the banner ads on it's “how-to” content pages. To drive these metrics back in the right direction, the eHow team experimented with a sticky banner ad, which would stay visible on a reader’s screen until they scrolled to a certain depth on each page. They hypothesised that making the banner sticky would keep it in view for a longer period of time, thus improving its visibility. They tracked a variety of metrics, including ad viewability, reader scroll depth, and engagement.


eHow experimented with a sticky banner ad, which would stay visible on a reader's screen until they scrolled to a certain depth on each page.
As the results came in, eHow was met with another challenge. While the sticky banner did improve ad viewability metrics, there were also negative side effects. It seemed that the sticky banner performed well in the eyes of advertisers, but not readers – scroll depth and engagement with related content, and pageviews plummeted.
eHow used this information to iterate, testing a second option. In this iteration, they still opted for the sticky banner, but controlled its display based on time, rather than scroll depth. After a reader had been on the page for a certain amount of time, the sticky banner would disappear. They hypothesized that this option would better meet the needs of both advertisers and readers. The idea being that the ad would disappear more quickly in this case (as soon as it met the appropriate attention requirements), giving readers a undisrupted experience earlier on, while their interest in the article was still piqued.
The results for the iterated variation of the sticky banner were overwhelmingly positive, greatly improving ad viewability metrics without disrupting engagement, scroll depth, or pageviews. These results helped inform changes made across eHow’s content pages. eHow was able to use higher viewability metrics to increase the value of its display inventory to advertisers. The end result? Significant gains in ad revenue for eHow, better viewability for its advertisers, and a high-quality experience for readers.
A.R. Tabrizi
Optimization Manager, Demand Media, eHow