
I’ve spent the past year building AI analytics capabilities in Optimizely Analytics, and the same theme comes up with customers and prospects:
We’ve heavily invested in our warehouse and have a great analytics team, yet the product team is still waiting two weeks for a basic retention report, and my analytics team is stuck doing primarily reactive work.
The issue isn’t warehouse access—most people can get read access with a request. The real challenge is that analysis requires SQL or data modeling skills, often along with learning another tool. As a result, people usually can’t get the answers they need without going through an analyst.
Even for analysts who are fluent in SQL, some product analyses take time without the proper tooling. Building a retention analysis with the right time windows, business logic, and cohort definitions in a traditional BI tool can take days.
And when the inevitable questions from the PM comes, “This is great, but can we change the retention chart to measure from the user’s first purchase instead of their signup date?”
Now the analytics team is stuck redoing all the date logic, rebuilding the measures, and fixing every visual that depended on the old definition.
That’s the two-layer problem I see over and over:
-
Product and marketing users can’t easily or quickly pull answers from the warehouse.
-
Analysts get buried in complex (and not complex), one-off requests that spawn endless follow-ups.
That’s why we’re building AI-powered analytics to augment human capabilities, unblock business teams, and free up analytics experts to focus on the highest-leverage work.
The analytics bottleneck that's killing your warehouse ROI
Data teams everywhere are facing the same impossible equation.
Massive warehouse investments + skilled analysts + eager business users = still waiting weeks for insights.
The infrastructure success story is real:
-
91% of enterprises have invested in cloud data warehouses (Gartner, 2024)
-
The data warehousing market size was valued at USD 34.9 billion in 2024 and is expected to reach USD 126.8 billion by 2037 (Research Nester, 2025)
But the business adoption reality tells a different story:
- Only 32% of organizations achieve true self-service analytics (Gartner, 2024). Even fewer manage it directly on their warehouse data.
- Business users still wait 7-10 days for new reports (ThoughtSpot Research, 2024)
- Data analysts spend 70% of their time building reports versus strategic analysis (McKinsey, 2024). They're stuck in reactive mode instead of proactively identifying opportunities.
- Product managers make roadmap decisions without data backing because insights arrive too late
It's an access problem that leads to teams spending most of their time building dashboards.
When analysts become human dashboard generators
Here's the workflow that's burning out your user experience analytics team and frustrating your business users.
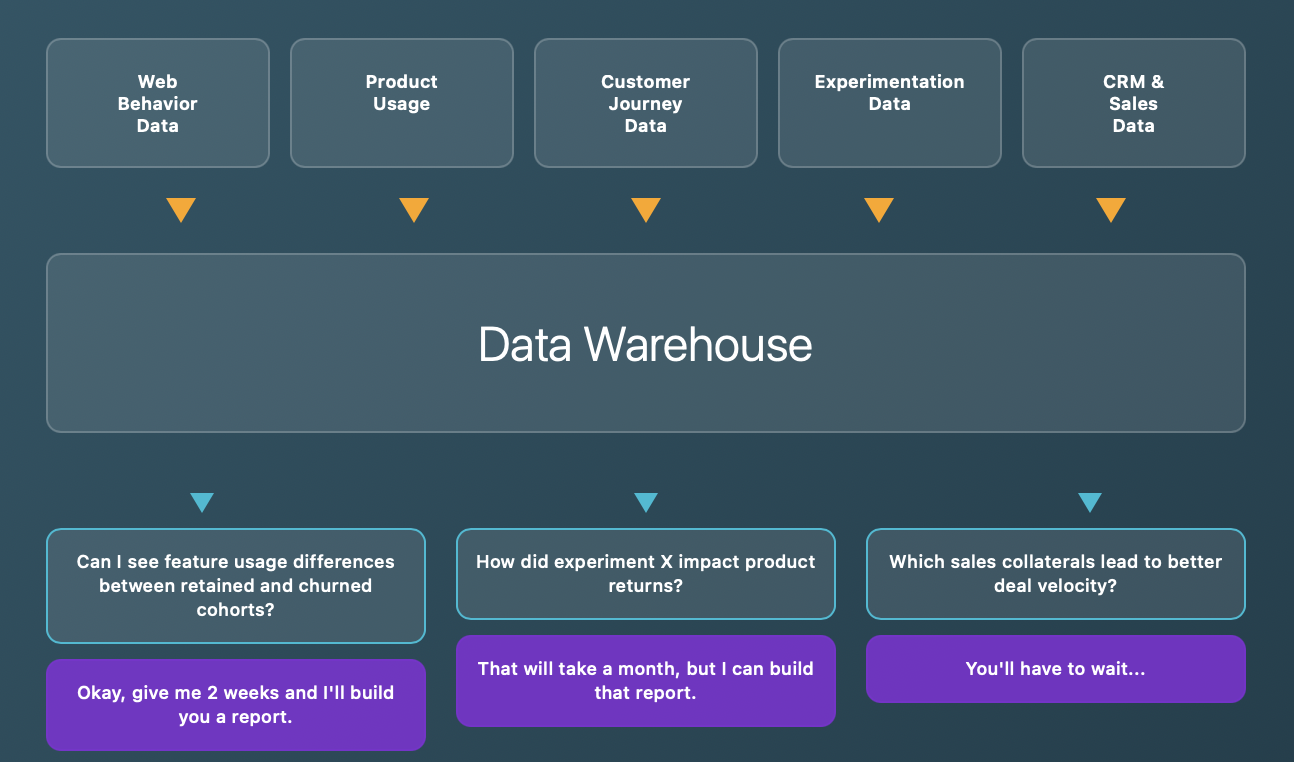
Image source: Optimizely
Here's how:
- Step 1: The business user has an urgent question about customer churn, feature adoption, or campaign performance that can only be answered with warehouse data.
- Step 2: Submit an analytics request because most business users don't know how to write SQL. Even if they did, they likely wouldn't know event names, schema, or where to find the right data.
- Step 3: Join the analyst queue, where urgent requests compete with routine reporting and infrastructure maintenance.
- Step 4: An analyst drops what they’re doing, writes custom SQL, and builds a dashboard , knowing it’ll probably lead to five more “can we also…” follow-ups.
- Step 5: By the time the report is ready, the decision window has passed. The data is technically “right,” but it’s stale.
- Step 6: The cycle repeats. Business teams miss opportunities. Analysts wonder why they were hired to do strategic work but spend their week cranking out one-off reports.
Talking to analysts, they feel like "human data generators" instead of strategic advisors. This is a systematic underutilization of both your warehouse investment and analytics talent.
How AI in analytics will improve your existing workflow
When AI capabilities work together, the entire relationship between users and warehouse data changes:
Old workflow:
Question → Analytics request → Wait in queue → Get static report → Generate follow-up questions → Repeat cycle
New AI-powered analytics workflow:
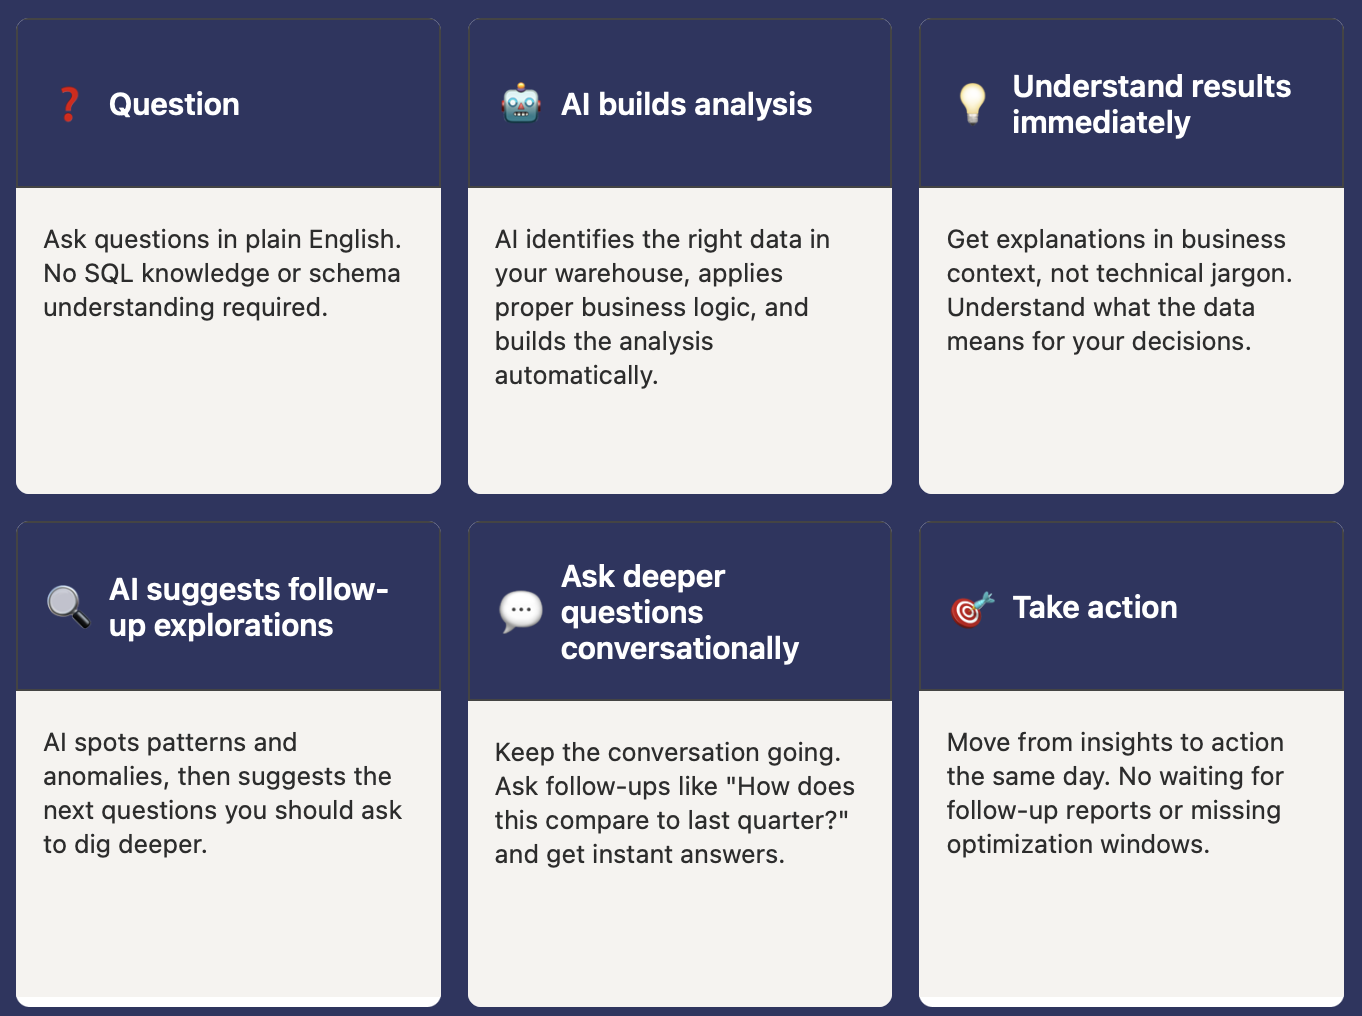 Image source: Optimizely
Here’s an example:
The marketing manager needs to understand Q4 campaign performance across channels and prospect segments.
Traditional approach: Submit request to analytics team → Wait 5-7 days → Receive dashboard → Realize you need additional segmentation → Submit follow-up request → Wait again → Miss optimization window.
AI-powered approach:
- Ask: "How did our Q4 email and social campaigns perform for enterprise prospects?"
- AI automatically identifies attribution data, segments by prospect size, and compares channel performance.
- AI explains: "Email outperformed social 2.3x for enterprise prospects, with the highest engagement from reporting feature demos."
- Follow-up: "How does this compare to SMB prospects?" → Instant comparative analysis
- Action: Reallocate budget and optimize campaigns the same day
What used to take weeks of analyst support now happens in minutes. AI in analytics serves as a pathfinder that connects data patterns to actionable next steps.
The self-service analytics paradox
Most "self-service" analytics tools assume business users will learn complex interfaces and understand data schemas. In reality, these assumptions frequently create more bottlenecks than they solve.
How AI removes friction in traditional self-service tools:
- Business users don't know event names or table structures
- Complex visualization tools require training that most users never receive
- Technical barriers force business users back to requesting analyst support
- Data exploration becomes guesswork when users can't understand what they're looking at
The hidden cost: Your most valuable business data stays locked behind technical barriers while teams make decisions based on intuition, outdated reports, or incomplete analysis.
Right now, a lot of analytics teams spend much of their time on routine reporting, which leaves less room for projects like predictive modeling, which can have a bigger business impact and requires more specific expertise.
Instead of forcing business users to learn SQL, schemas, and visualization tools, AI analytics works the way people naturally think about their business. You ask questions in plain English, and AI handles the technical complexity of finding the right data, applying proper business logic, and presenting insights that make sense for your specific context.
It's a fundamentally different relationship with your data where the warehouse becomes as accessible as asking a colleague a question, while maintaining the depth and accuracy that only your complete data context can provide.
Three real use cases that will change everything
AI doesn't just speed up analytics; it removes the technical barriers that keep business users dependent on analysts, freeing up your analytics team to focus on strategic work instead of routine report requests.
Further, AI analytics agents are a major step in making analytics easier, faster, and more actionable for our customers. This is all about moving from data → decisions with less effort.
1. AI exploration generator: Removing the data schema knowledge barrier
You ask questions in human language, and AI will automatically build visuals for you without requiring any technical knowledge.
How it works:
- You ask: "Which features do enterprise customers adopt fastest?"
- AI automatically identifies relevant product usage events in your schema
- Applies appropriate customer groupings and time-based analysis
- Generates visualizations showing adoption patterns by customer tier
- Highlights features with the fastest enterprise uptake rates
What this means: Anyone can explore product data without knowing SQL or the schema. Business users get answers in minutes. Analytics teams spend less time on ad-hoc requests and more time on high-impact work.
2. Opal Chat: The analytics assistant that understands your business
Configuration guidance will walk you through the analysis setup and explain what the results mean in a business context.
Image source: Optimizely
The chat displays the following information:
- A brief summary of your exploration
- Key takeaways
- Next steps and suggestions
For example, you can ask "How do I set up a conversion funnel for mobile users?" and get step-by-step setup help instead of hunting through documentation or submitting help desk tickets.
3. Exploration summary
Click to get instant business-context explanations of any visualization.
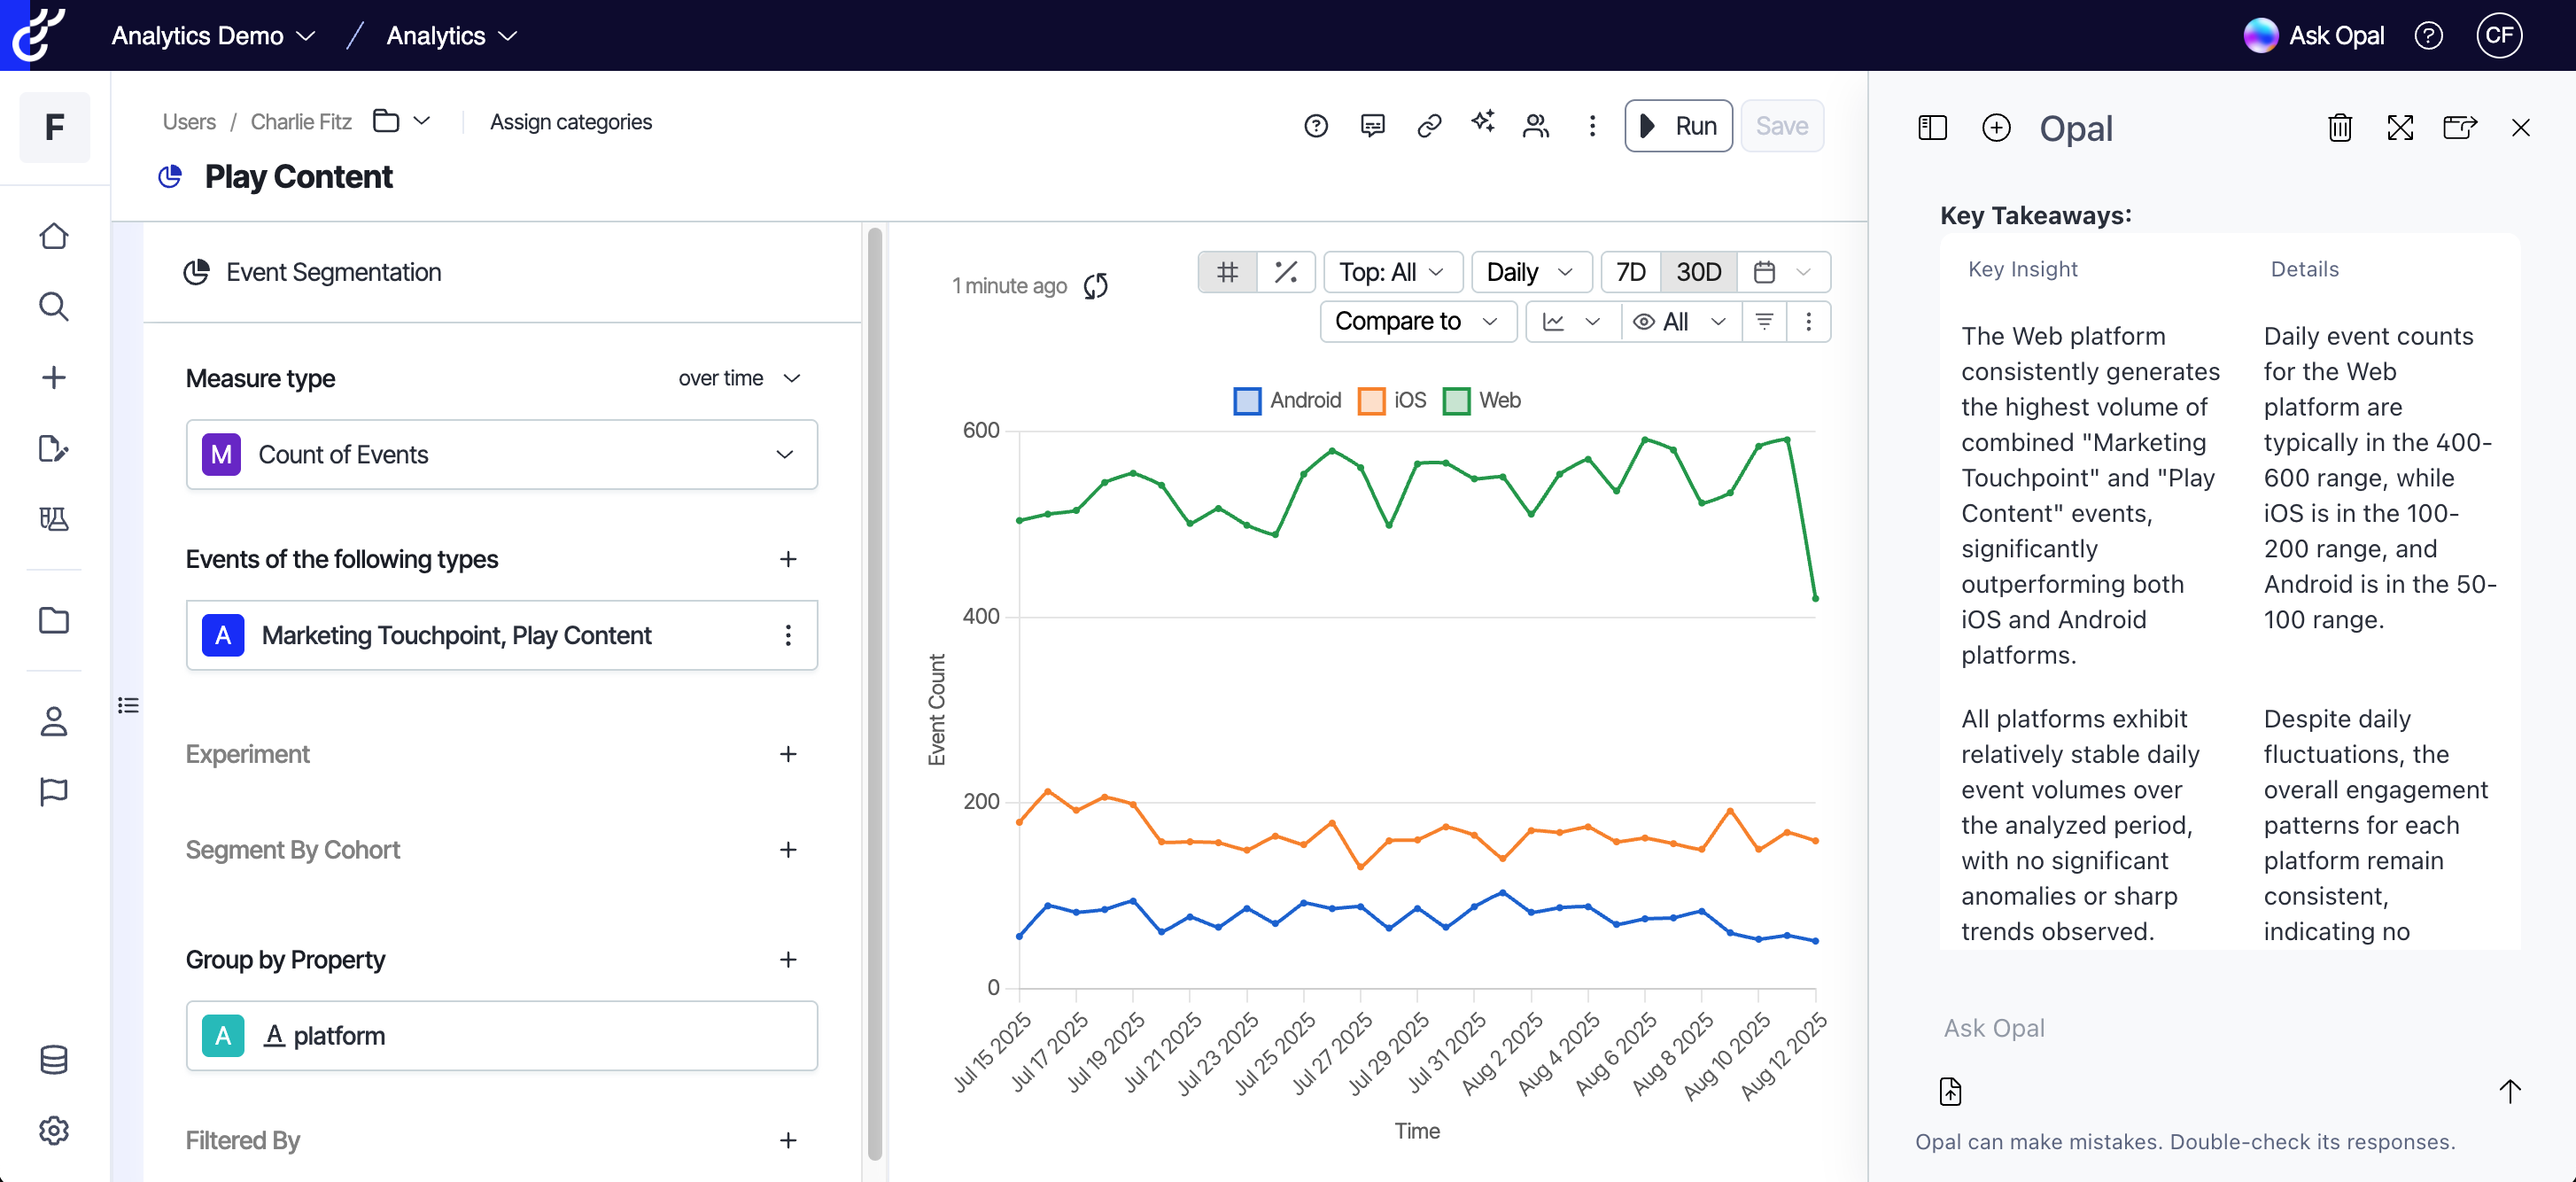
Image source: Optimizely
For example, "Enterprise user engagement dropped 15% after the UI update, with the biggest impact on your reporting dashboard feature."
Beyond helping you understand results, this saves analysts from writing lengthy stakeholder updates.
After AI has created a couple of explorations for you, creating your own becomes much simpler.
From there, you can use the built-in visualization templates to start with an empty template and utilize various explorations to tailor your dashboard and reporting needs.
The chart summary agent turns charts/tables into key takeaways with one click.
But here's what changes everything.
The warehouse-native advantage. You'll enjoy the full benefits of AI-powered analytics democratization if it operates directly on your warehouse data with complete business context.
Why warehouse-native AI is different:
- Complete data context: Optimizely AI-powered analytics understand complete data context beyond just behavioral event data, including customer lifecycle, product usage, revenue patterns, marketing attribution, and operational metrics, all from your warehouse history.
- Single source of truth: No data movement. AI works directly with your warehouse, where all your business data already lives, ensuring consistent insights across teams.
- Unified metrics governance: Manage all of your metrics in one location to ensure consistent definitions across all teams.
- Integration advantage: Teams can seamlessly connect experiment analysis with broader business data in one single location.
All of it so your...
Marketing team can analyze attribution across all touchpoints with complete customer lifecycle context.
Product team can explore feature adoption patterns alongside revenue impact and customer segmentation data.
Analysts can focus on predicative high-leverage analytics tasks.
Here's Vijay Ganesan, VP, Software Engineering, sharing what warehouse-native analytics actually means.
When it comes to data democratization tools, speed compounds
Here's how you can make better decisions while competitors wait for reports.
The organizational multiplier effect: When every department head can access unified data directly, experiment teams analyzing impact on retention, product teams analyzing feature adoption, operations optimizing based on real-time metrics, decision velocity increases dramatically.
The multiplying advantage:
- Decision velocity: Your teams move from question to action in minutes vs. days
- Resource multiplication: Your data-guidance folks start focusing on strategic modeling vs. routine reporting
- Learning acceleration: Faster insight cycles enable rapid optimization and competitive adaptation
- Opportunity capture: Warehouse-native data access means catching trends and problems while they're actionable
The path forward...
The next phase of product analytics isn’t about displacing analysts; it’s about unencumbering them so they can focus on the high-leverage, strategic work they were brought on to do.
Consider:
- Which recurring analyses could be operationalized or fully automated today?
- Which business questions still take weeks to answer when they should take minutes?
- Which opportunities are being overlooked because the team is mired in dashboard maintenance?
Your data warehouse is the substrate. Layering AI-driven analytics on top is how you convert that asset into a durable competitive advantage.
The question is whether you'll lead this transformation or watch it happen around you.


- Last modified: 11/25/2025 8:08:29 AM