Qualitative Questions That Lead to Great A/B Tests
You’ve asked everyone in your company. You’ve looked to your competitors. You talk about it with your friends at happy hour. You’re trying to come up with ideas for your next big A/B testing win. Pulling qualitative feedback is the next best place to look. If you’re not getting qualitative with your data to understand your visitors better, then you’re missing out on one of the biggest pieces of learning.


 You’ve asked everyone in your company. You’ve looked to your competitors. You talk about it with your friends at happy hour. You’re trying to come up with ideas for your next big A/B testing win.
Pulling qualitative feedback is the next best place to look. If you’re not getting qualitative with your data to understand your visitors better, then you’re missing out on one of the biggest pieces of learning.
Qualitative feedback provides purposeful interpretation about a person’s actions online. Either people are doing something you want them to do and you want to find out why they’re doing it, or people are not doing something you want them to do and you want to find out why they’re not doing it. That’s the purpose of qualitative feedback. Quantitative feedback shows you what people did or didn’t do, but it misses the why.
Why is qualitative feedback important to optimization?
By looking at qualitative feedback, what you’re really trying to figure out is how to run more successful tests—and everyone wants more successful tests! While talking to businesses lately, I’ve noticed a trend: people don’t know how to think about incorporating qualitative information in the right stages of their experimentation process.
In this article, you’ll learn about how software as a service (SaaS), e-commerce, and media companies can gather and interpret qualitative feedback to generate ideas for A/B tests by using email, on-site surveys with Qualaroo, and website heatmaps with CrazyEgg.
If video is your thing, you can check also out my talk on this topic from Optimizely’s user conference, OptiCon.
Collect qualitative data from email.
To collect actionable feedback via email, ask people a single question that asks them to reply with their answer.
Email is one of the easiest ways to add some friendly personality to your message. Subjects and body content are important to getting people to engage with your question.

Example of an Intercom email for new users.
Intercom is a great tool for emailing people to ask behavioral questions because you can easily segment by new or existing users.
Pro tip: Google Forms (for surveys) can be embedded right in your email.
Here are suggestions for questions to ask in your emails:
| E-commerce | What prevented you from completing your purchase? |
| SaaS | Why did you not sign up after your trial? |
| Media | What topics should we write about next? |
Collect qualitative data from Qualaroo.
Qualaroo allows you to create surveys to gather qualitative feedback right on your website about your user experience.
I like Qualaroo because it reaches people in the moment when they’re doing the thing you’re looking for feedback on. on the page or when they’ve already clicked and gone onto the next page and then it asks them why they clicked or why they did the last thing.
Qualaroo surveys can look something like this:

The intent is much higher when you ask them a question in the moment.
The feedback you receive is contextual and specific because you know what page they were on when they answered the question and the feedback pertains to that page.
Tips for using Qualaroo for:
| Industry | Goal | Questions to help you figure out why people aren’t converting |
| Ecommerce | Figure out what’s missing from the page to help the customer make a decision. | Missing information could be size information, color information, compatible with this other thing that I have. Ask, “Is there information missing on the page?” If you notice people are adding items to their cart but not checking out, you can ask them, “why have you not completed the purchase yet?” |
| SaaS | Figure out demographic info about the visitor to show the right content. | Ask people about their job function. Then ask them “What’s preventing you from signing up?” With this information, you can start to understand the type of targeting you can do and also what kind of words you should be using on the page based on specific demographics. |
| Media | Figure out ways to recommend content effectively to increase your pageviews per visitor. | One of the most valuable things you can do with Qualaroo on media sites is determine if people find the current article valuable. Then use that information to test other types of related articles they should be seeing based on the category they’re viewing. Ask, “What would you like to read about next?” |
CrazyEgg is a heat mapping tool that allows you to see where on a page people are moving their mouse, clicking, or scrolling.
Collect qualitative data from CrazyEgg.
Tips for using CrazyEgg for:
| Industry | Goal | Sample heat maps case studies that uncover test ideas. |
| Ecommerce | Learn how people are using search and filtering using interaction analysis with Crazy Egg. | This example highlights a travel company who questioned whether they were offering the right form options on the right page. This heatmap indicated that there were many underutilized fields. Based on this heatmap, the image below is a possible test they could run on this form to measure whether it generated more conversions. Based on this heatmap, the image below is a possible test they could run on this form to measure whether it generated more conversions.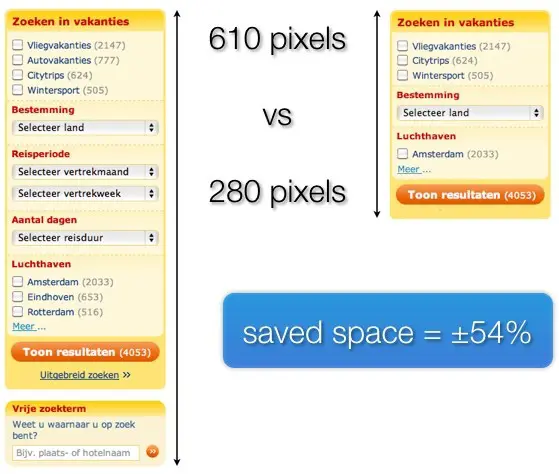 |
| Understand the importance of image/badge placement. | Heat maps can help you prove the value of including sale/offer badges and give insight on where to place them on a product image. On the heat map below, visitors clearly click offer badges often. |
|
| SaaS | Learn where to place call to action buttons based on scroll maps of where people are scrolling to on pages. | RJMetrics used a scroll map to discover that their “Sign Up” button was not being seen by most people. This information inspired a test: moving the button up into the white zone. This move resulted in a 310% conversion increase. |
| Learn which header and footer links are most popular. | Armed with this information, you could discover new ways to completely rearrange your navigation to drive more clicks to desired destinations. The heatmap below is an example from KISSmetrics. |
|
| Use Confetti to segment visitors and understand click patterns. This can be used for setting up experiments for specific traffic. | Example of a Confetti map for new versus returning visitors: Example of a Confetti map for visitors broken down by geographic location: Example of a Confetti map for visitors broken down by geographic location: |
|
| Media | Media sites tend to have a lot of interactive elements, such as recommended posts and things like Hello Bar. Crazy Egg can help you understand how visitors are interacting with those elements. This information can be used to create hypothesis for experiments. | This heatmap shows clicks on a recommended content module on a blog: This heatmap shows percentage of clicks on links around the site: This heatmap shows percentage of clicks on links around the site: |
Interpreting qualitative data.
Before we talk about how to interpret qualitative data, you might be wondering who should do it. Who should be responsible for analysis in general?
The short answer is that it doesn’t really matter who does it as long as the information is shared with the people that come up with hypotheses for experiments. Sharing data is part of building a healthy testing culture.
As long as everyone is able to see the information—especially qualitative information—you’ll get better test ideas. Collecting feedback is crucial and taking action on that feedback is where the rubber meets the road.
The way to do this is ensure that the knowledge is shared.
Interpreting data from email.
Once you’ve sent your email blasts and started to get responses, it’s important to go through every reply.
If you’re using Google Forms emailing method you’ll get responses straight into a Google doc.
Embedding surveys in emails is one of my favorite methods of surveying because it reduces the amount of clicks the visitor has to do. For Survey Monkey they have to click on a link in the email to get to the survey. With surveys that are embedded in email, you don’t need to do that, people can respond right in the email. You should test both methods to see what gets a better response rate from your audience.
Interpreting data from Qualaroo.
It’s very important to actually go through the pain (I’d call it joy) of reading every single response and categorizing it. Once you categorize it, it becomes very clear what category of things is most popular.
Survey Monkey has a tagging feature where you can actually tag responses and you can see what the popularity of these tags are that you created. Categorizing it to understand the bucketing of what people are saying will really help you prioritize where to focus your attention around the experiments.
In this article, the folks at MailChimp layed out their process for analyzing surveymonkey data (see: “Prepping Open Response Survey Data for Analysis” section).
How to interpret a heat map and base test ideas off of it.
Some of the insights uncovered with heat maps are available in analytics but many are not discoverable any other way. Just creating a Crazy Egg report for key pages that get a lot of traffic or are important will help you discover what’s going on with those pages in a visual way. Interpreting the Crazy Egg reports will help inform the types of things you should be focused on testing.
Heatmaps help you see the hot spots (or cold spots) on each page at a glance so you know what to change, preserve or delete. These are some questions heatmaps help you answer:
- Do visitors think they can click greyed out buttons?
- Test changing the way they look, removing them until necessary or turning them into links.
- Is prime real-estate on boring stuff?
- Test removing the boring stuff to see if it impacts conversions.
Scrollmap shows you how far your users scroll and where their attention fades or disappears.
- Does a long-form sales page work for our visitors?
- The length of a page can impact conversions so you can discover what people care about and try to remove elements from a long page or add elements to a shorter page.
- What content should we keep above the fold?
- If key elements are below the fold, you can test moving them above the fold.
Overlay is used to see the percentage of visitors clicking something.
- What percentage of traffic clicked the primary button versus this smaller link text below it?
- Knowing the difference in the clicks can help with changing the copy, style of an element or even removing altogether.
- How many people clicked Pricing in the nav instead of clicking the Pricing button down the page?
- If more people are clicking an element lower on the page versus the one with the same destination higher, you can test adding a new one in the middle of the page.
Confetti allows you to dig deeper into the data and find out who clicks what. Map traffic sources and other segments to visitor behavior.
- What does our traffic referred from Facebook do here?
- If a specific traffic source is not converting or clicking on the CTA you can test a variation just for that source.
- Is there a difference between what new visitors and returning visitors click on or how far they get down the page?
- You can discover whether targeting return visitors with a variation just for them can improve your conversions.
What to do next?
It’s tough to constantly come up with winning tests based on you or your team’s opinion. Having evidence from people of what’s important to test is key to having more tests win. A strong pipeline of test ideas that are based on evidence from qualitative data is what’ll help you never run out of things to test.
Start learning from the people that engage with your website and buy from you.
Do one of the following to just get started: send an email to learn why people aren’t doing what you want them to, create a survey for a key page on your website or run Crazy Egg on your website. If you do all three you’ll learn much more in a shorter amount of time which will lead to more winning tests, higher conversions and faster growth.
About the author

