What is product analytics? The complete guide
Product analytics has evolved dramatically from its early days of basic dashboards and isolated data points. As we advance through 2025, we're witnessing a fundamental transformation that extends far beyond traditional tracking methods to embrace an integrated, intelligent, and privacy-conscious approach that puts business outcomes at the center.
But modern product analytics goes far beyond vanity metrics and basic reporting. It's about asking the most relevant, incisive questions and using a wide range of data to connect the dots between product usage and business impact.
To drive sustainable product-led growth, today’s teams need deep, cross-functional insights that span the entire customer lifecycle. That means visibility into everything from a user’s initial experiences with your brand, to their first "aha moment" when they realize its value, to their day-to-day feature usage, struggles, successes, and multi-channel interactions. Product analytics should give you a holistic view of all the touchpoints that ultimately drive satisfaction, retention, and customer lifetime value.
That's where next-generation product analytics tools are game-changers. By making it easy to unify, visualize, and model complex user and behavioral data across channels, warehouse-native tools like Optimizely Analytics empower product-centered companies with a 360-degree view of the customer experience.
What is product analytics?
Product analytics describes the practice of leveraging user data and behavioral insights to inform strategy, drive innovation, and optimize the customer experience. From unpacking granular user behaviors to uncovering the “why” behind churn, it's about using data to drive deliberate, continuous improvement and growth rooted in facts — not hunches or gut instincts.
Some key benefits of effective product analytics include:
- Validating product-market fit by analyzing activation, adoption, and critical “aha” moments
- Prioritizing high-impact product roadmaps based on feature usage, stickiness, and revenue impacts
- Optimizing the entire user journey by connecting rich product, marketing, sales, and support insights
- Minimizing churn by identifying drop-off points and behavioral red flags leading to retention risks
- Democratizing data-driven decisions with self-serve analytics available for all roles across an organization
- Measuring the precise impact of every release, experiment, and growth initiative through cohort analyses and more
- Enabling effective product-led growth by tying product data to marketing, sales, support, and expansion metrics
The new paradigm: AI-powered, real-time, and warehouse-native
AI integration
The most significant shift in 2025 is the integration of AI and machine learning directly into product analytics workflows.
Modern platforms now offer automated insight generation, predictive churn modeling, and intelligent anomaly detection that operates in real-time. Companies are leveraging AI to automatically identify patterns in user behavior, predict customer lifetime value, and recommend optimizations without manual analysis.
Machine learning algorithms now enable advanced user segmentation that goes beyond simple demographic categorizations, using multi-dimensional behavioral data to create dynamic, evolving user clusters. This allows businesses to understand not just what users do, but why they do it, enabling proactive strategy formation rather than reactive responses.
 Watch the full Warehouse-native analytics webinar: the future of experimentation here
Real-time analytics
Real-time analytics has become a competitive necessity rather than a luxury. Companies are processing massive data streams - with leaders like Uber handling 8 trillion Kafka events daily- to enable instant decision-making. The shift from batch processing to continuous, real-time data activation allows businesses to respond to customer behaviors as they occur.
Organizations are discovering that the value of data decays rapidly over time, with critical insights becoming actionable only within seconds or minutes of occurrence. This has driven widespread adoption of real-time data enrichment solutions that provide immediate customer insights and enable instant personalization.
Warehouse native
The warehouse-native approach has evolved beyond simple data consolidation. True warehouse-native solutions now offer dynamic configuration with exploratory insights, allowing teams to analyze data on-the-fly without lengthy ETL processes. This enables virtual events, dynamic functions, and analysis of unstructured data directly within customer data warehouses.
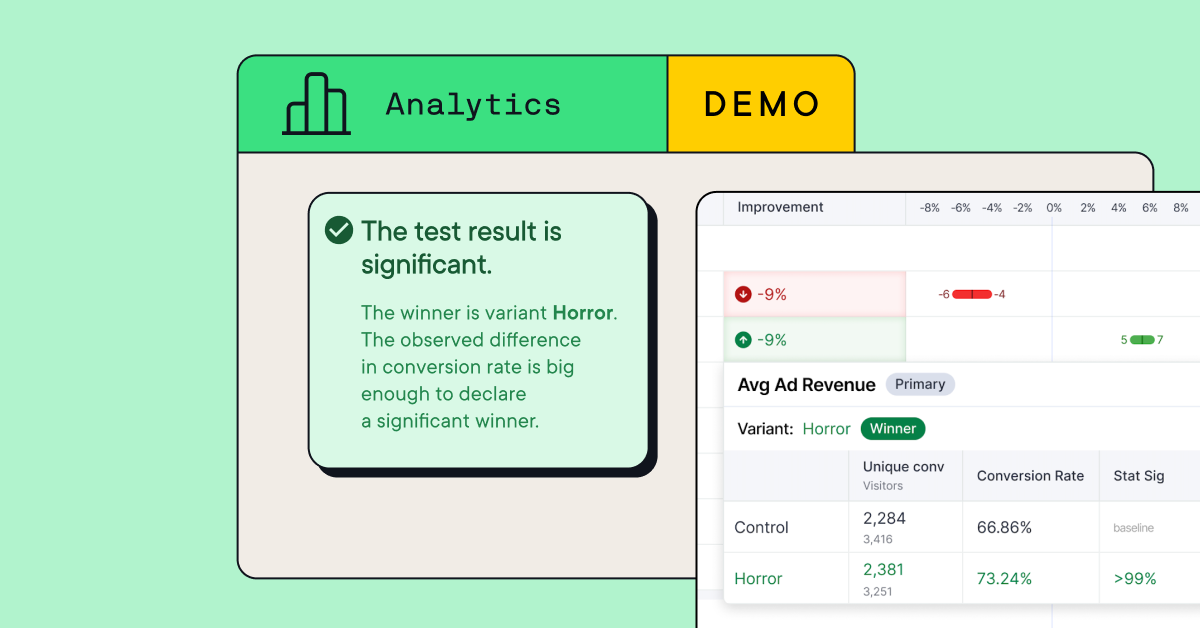
The key advantage is business outcome attribution - teams can now test directly against metrics that actually influence business outcomes, from revenue and return rates to customer lifetime value, all without moving sensitive data. This approach eliminates data silos while maintaining complete control over data security and governance.
Who needs product analytics?
Companies focused on product-led growth know that effective product analytics create value across the entire organization, not just on product teams.
- Product managers validate hypotheses by mapping feature adoptions to downstream conversions and revenue. They prioritize roadmaps based on quantified impact metrics, measure every launch/release, and tie changes to strategic KPIs.
- Growth teams attribute top-of-funnel marketing and acquisition efforts all the way through to activated product usage, conversions, and ongoing stickiness. They can model new tactics by exploring how channels correlate to product behaviors.
- Product ops streamline flows like onboarding and implementations using insights from comprehensive customer journey analytics across product, marketing, sales, and support data.
- Customer success teams gain visibility into churn and expansion risks by analyzing product usage cohorts in the context of other customer signals — and then drive timely nurture campaigns.
- Marketing teams improve their campaign ROI by building advanced segments based on product qualification criteria and mapping ad spend to activated usage through the full funnel.
- Executive teams set data-driven strategies, OKRs, and growth goals based on quantifiable impacts illuminated through unified product analytics.
- Experimentation practitioners can test against historical data that was previously difficult to access or lived on different teams
By breaking down data silos and combining product usage and customer journey data, modern, warehouse-native product analytics can fuel smart, user-centric decision-making across companies.
Take a look at our breakdown to learn more about the convergence of product vs marketing analytics.
Key metrics for product analytics
For effective product analytics, teams need insights into key metrics that measure user adoption, engagement, retention, and more. Commonly tracked product metrics include:
Adoption metrics
Activation rate: This is the percentage of new signups that experience core product value, taking a critical "aha" action. To measure activation, you’ll define a specific action, event, or experience relevant to your product. For a project management tool, activated users might be those who create and share their first board, while for a streaming audio platform, it could be listening to X minutes of content. Increasing activation rate is key for driving top-of-funnel growth and demonstrating product-market fit.
Time-to-value: This metric tracks how quickly users adopt your product and hit value milestones after signing up, indicating successful onboarding and activation. You typically measure time-to-value by setting up funnel analytics and tracking the sequence of events and time elapsed between signing up and activation milestones. A shorter time-to-value impacts downstream revenue metrics like trial-to-paid conversion, subscription upgrades, etc.
Daily/Weekly/Monthly active users: Stickiness metrics like DAU, WAU, and MAU measure recurring usage of your product. Stickiness is an indicator of product adoption, habit formation, and user loyalty, which are critical for driving retention and maximizing customer lifetime value.
Engagement Metrics
Session length: The average duration of a user's session using your product or service helps you understand how users are engaging and whether they’re deriving enough value per visit to keep coming back. You measure it by tracking the time between user session start and end events, taking the average or median across your user base. Improved median session length metrics could also signal that new features or fixes are successful.
Feature usage & adoption: Insights on percent-wide usage of specific product capabilities, features, or modules are vital for validating your development efforts and product-market fit. You track them by instrumenting product analytics on key features and user flows of interest.
Funnel conversions & dropoffs: It’s important to analyze the percentage of users who complete defined stages or an entire journey in your product, versus those who abandon a particular funnel stage. This helps you pinpoint areas where users are experiencing friction rather than moving smoothly through critical product flows so you can optimize their journey. You measure conversions and dropoffs through funnel visualization and analytics, tracking the process from entry point through each step to final conversion.
Cross-channel attribution: Organizations are implementing comprehensive attribution models that track customer journeys across multiple touchpoints, from initial acquisition through long-term engagement. This holistic view enables more accurate ROI measurement and strategic resource allocation.
Retention/Churn Metrics
Customer Lifetime Value (CLV/CLTV): These are projections of the total revenue a customer will generate during their full engagement with your product or service. The most common models factor in gross revenue, churn rate, and overhead costs. Increasing CLV is a constant goal for any company focused on product-led growth.
Churn rate: The rate at which customers cancel subscriptions or fail to renew their paid plans (i.e. “churn”) is a make-or-break metric that directly impacts your growth potential. You measure churn both by number of users (logo churn) and percentage of recurring revenue (revenue churn).
While these product metrics are important diagnostic tools, truly driving product-led growth goes beyond reporting on out-of-the-box events and numbers.
Product-focused teams need to understand product metrics in the full context of constantly evolving business performance indicators and customer journey insights.
What's shaping the future of product analytics?
Customer data platforms (CDP)
AI-Enhanced CDPs: Customer Data Platforms have evolved into AI-powered systems that provide predictive analytics, dynamic segmentation, and automated decision-making. Modern CDPs use machine learning to unify data from multiple sources, predict customer behavior, and enable real-time personalization without manual intervention.
The CDP market is experiencing explosive growth, projected to reach $63.71 billion by 2031, with small and medium enterprises showing a 35.8% CAGR as they recognize the strategic value of centralized data management.
Industry-specific solutions: The trend toward industry-specific CDPs is accelerating, with platforms designed for healthcare, finance, retail, and other sectors incorporating built-in compliance tools and optimized workflows. This specialization enables faster implementation and more relevant insights while addressing sector-specific challenges and regulatory requirements.
Data democratization and self-service analytics
Empowering business users: The democratization of data access through self-service analytics has transformed how organizations operate. Modern platforms enable non-technical users to access, analyze, and visualize data independently, reducing dependence on technical teams and accelerating decision-making.
Organizations implementing self-service analytics report 10% revenue growth, 40% improvement in time to market, and 35% increase in new customer acquisition. The key is providing user-friendly tools that maintain enterprise governance while enabling exploration and discovery.
Breaking down data silos: Successful data democratization requires more than just tools - it demands cultural transformation and cross-functional collaboration. Organizations are establishing data governance frameworks that balance accessibility with security, ensuring data quality while enabling widespread usage.
Predictive analytics and business intelligence
Advanced behavioral modeling: Predictive customer behavior modeling has become sophisticated enough to forecast purchase patterns, churn probability, and lifetime value with remarkable accuracy. Modern systems analyze multiple data dimensions including purchase history, engagement patterns, and support interactions to create comprehensive customer profiles.
Companies using predictive analytics report 50% increases in leads, 60% reductions in call times, and overall cost reductions of up to 60%. The technology enables proactive customer engagement rather than reactive responses.
Real-time decision making: The convergence of predictive analytics with real-time data processing enables organizations to make instant, data-driven decisions. Retailers can now adjust inventory and pricing in real-time based on demand predictions, while service companies can proactively address customer issues before they escalate.
Future-focused product analytics with Optimizely Analytics
In the words of Yali Sassoon, Co-founder of Snowplow:
“First-gen tools allowed us to understand behavior in new ways, but they start hitting ceilings as the user journey gets complex and we ask deeper questions across multiple data sources.”
New, warehouse-native analytics platforms solve this by running directly off a composable-CDP warehouse that acts as a single source of truth. Next-gen tools like Optimizely Analytics empower companies to explore rich first-party product, customer, and business data.
And game-based fitness company Ergatta replaced legacy digital product analytics tools with Optimizely Analytics’s next-gen solutions. This let them easily blend their connected app usage data with marketing, demographic, subscription, and support ticket insights — improving time-to-market & adoption of new programs/features as well as reactivation and re-engagement of inactive users.
"Optimizely Analytics is the Holy Grail of product analytics. You don't have to move your data anywhere. It sits directly on your data warehouse, looks across all data sets, and supports both traditional BI analysis and modern event-centric product analytics. It is also self-service, so you can expand the reach and impact to everyone in the organization, not just technical teams."
— Chang Yu, VP of Product at Ergatta
Optimizely Analytics’s powerful self-service data modeling and visualization includes a wide range of pre-built templates and easy-to-use blocks that make it accessible to all stakeholders. But crucially, it also allows teams to run ad-hoc explorations, pivoting to investigate emerging questions and slicing and dicing the data at all levels. That gives unprecedented access into the full, 360 customer journey.
- Last modified: 7/8/2025 9:10:54 PM