Optimizely is Heating Up with ClickTale and Crazy Egg
Heat maps are an incredible asset to website optimization.

Cara Harshman

Whether it’s actual mouse movements, concentration of clicks, or scrolling patterns, heat maps convey a story numbers cannot express. Pairing information from a heat map of your web page with the ability to optimize that page with A/B testing is a match made in conversion heaven. Thus, we are excited to announce one-click integration with two leading heat map services, ClickTale and Crazy Egg is now available for all Optimizely customers.

Optimizely announces one-click integration with heat map services, ClickTale and Crazy Egg.
Why you should care about heat maps.
For webpages, heat maps provide a qualitative assessment of what’s happening on the web page: a broad picture of where visitors focus their attention, the exact spot on a button a visitor clicks, or how long a visitor spends browsing “below the fold.” Analytics and A/B testing services provide the quantitative data for that page: conversions, number of clicks, bounce rates, page views, etc. Pairing qualitative insight from a heat map with the quantitative data from an A/B test completes the conversion story and fill in gaps from using each service independently.
Independently, heat map and A/B testing services are indispensable. ClickTale and Crazy Egg provide a holistic view of the customer experience while Optimizely enables you to optimize that experience. Leveraging the two together can take your A/B testing potential to a new level.

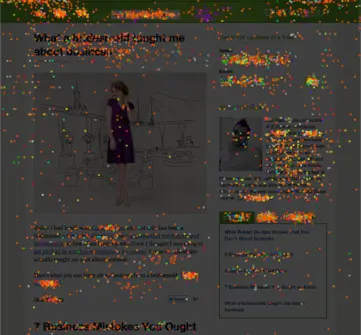
Example of a click heat map from Crazy Egg.
Heat maps can help you decide which elements to optimize. Before you even think about optimization, examine the heat map of your web page. Get a sense of how visitors are engaging, clicking, and navigating the page. Is one call to action button a hot bed of activity while the others are completely ignored? Explore data about your visitors’ behavior before testing everything.
Heat maps make for more informed and efficient goal tracking. Now you know what to test, but do you know what to track? After you have created variations in Optimizely, look at the heat maps of those variations before you set up tracking goals. Tracking too many elements could result in data overload.

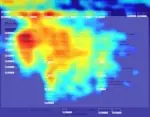
Example of a mouse movement heat map from ClickTale.
Even running the variations without tracking goals for a short time can help you discern which elements are most important to track in each variation. Maybe a certain image is driving heavy click traffic but it’s unlinked. You could be missing out on conversions. Heat mapping before tracking uncovers trends you didn’t expect and can make you realize your assumptions were wrong. Equipped with actual user data, you can then track page elements more efficiently and gather actionable insights faster.

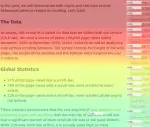
Example of a scroll heat map from ClickTale.
Heat maps help you figure out where to place important information. Scroll maps show you how much visibility each section of the page receives. If you find important information is located in a section visitors hardly see, try moving it up. For article pages, use the heat map to see how many viewers make it to the end of the article. With that information, you have a better idea on how to structure content and important offers.
What does integration mean exactly?
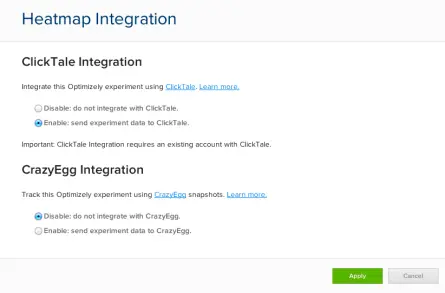
After enabling integration for either ClickTale or Crazy Egg (and all it takes it one click), you will see separate heat maps for each variation within Optimizely, thus have accurate information on how visitors experienced each different variation. Before integration, a heat map of a page running an Optimizely variation displayed information from every user interaction on that page, whether the visitor saw the original page, variation 1 or variation 5. This made for a muddled map with no discernable data on how visitors behaved for for different variations. Upon integrating the services, you will now see the correct page variation with the correct heat map; and any insights you gather from the heat map will translate directly to the A/B test.
While ClickTale and Crazy Egg both offer heat mapping, Click Tale also provides visitor playback. You can watch video recordings of individual visitors navigating the page and see how they interacted with the different versions you’re testing, seeing literally every mouse move, click and scroll they make. You can even search and segment by customer behavior e.g. recordings or heat maps of visitors that saw version A and went on to convert.
Pairing Optimizely with either ClickTale or Crazy Egg gives you the full picture of how people are experiencing your page and can quickly lead you to uncover the most successful A/B and multivariate tests.
(Note: In order for the integration to work you must have a ClickTale or Crazy Egg account.)
Optimizely + Crazy Egg support article | Optimizely + ClickTale support article
Have you integrated your experiments with a heat map? What are the most surprising insights you’ve discovered?
