text, letter

Classical statistical techniques, like the t-test, are the bedrock of the optimization industry, helping companies make data-driven decisions. As online experimentation has exploded, it’s now clear that these traditional statistical methods are not the right fit for digital data: Applying classical statistics to A/B testing can lead to error rates that are much higher than most experimenters expect.

Both industry and academic experts have turned to education as the solution. Don’t peek! Use a sample size calculator! Avoid testing too many goals and variations at once!

But we’ve concluded that it’s time statistics, not customers, change. Say goodbye to the classical t-test. It’s time for statistics that are effortless to use and work with how businesses actually operate.

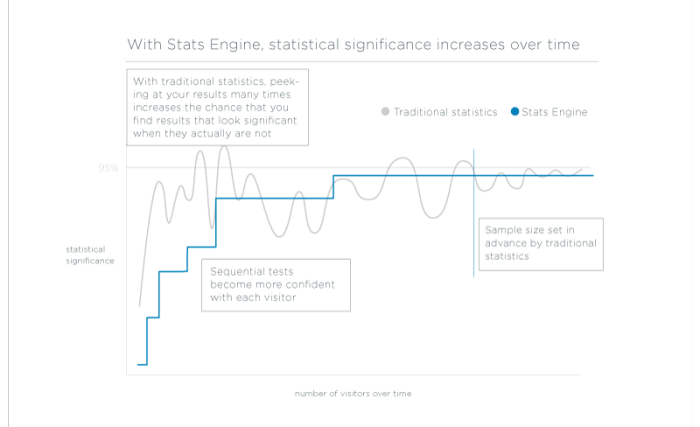
Working with a team of Stanford statisticians, we developed Stats Engine, a new statistical framework for A/B testing. We’re excited to announce that starting January 21st, 2015, it powers results for all Optimizely customers.

This blog post is a long one, because we want to be fully transparent about why we’re making these changes, what the changes actually are what this means for A/B testing at large. Stick with us to the end you’ll learn:

  • Why we made Stats Engine: The Internet makes it easy to evaluate experiment results at any time and run tests with many goals and variations. When paired with classical statistics, these intuitive actions can increase the chance of incorrectly declaring a winning or losing variation by over 5x.
  • How it works: We combine sequential testing and false discovery rate controls to deliver results that are valid regardless of sample size and match the error rate we report to the error businesses care about.
  • Why it’s better: Stats Engine can reduce the chance of incorrectly declaring a winning or losing variation from 30% to 5% without sacrificing speed.

Why we made a new Stats Engine

Traditional statistics is unintuitive, easily misused leaves money on the table.

To get valid results from A/B tests run with classical statistics, careful experimenters follow a strict set of guidelines: Set a minimum detectable effect and sample size in advance, don’t peek at results don’t test too many goals and variations at once.

These guidelines can be cumbersome, and if you don’t follow them carefully, you can unknowingly introduce errors into your tests. These are the problems with these guidelines that we set out to address with Stats Engine:

  • Committing to a detectable effect and sample size in advance is inefficient and not intuitive.
  • Peeking at results before hitting that sample size can introduce errors into results, and you could be taking action on false winners.
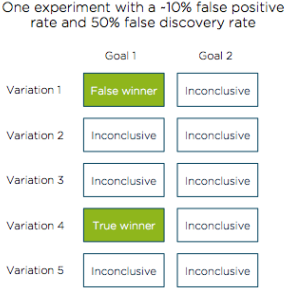
  • Testing too many goals and variations at once greatly increases errors due to false discovery—an error rate that can be much larger than the false positive rate.


Committing to a sample size and detectable effect could be slowing you down.

Setting a sample size in advance of running a test helps to avoid making mistakes with traditional statistical methods, To set a sample size, you also have to guess about the minimum detectable effect (MDE), or expected conversion rate lift, you want to see from your test. Getting your guess wrong can have big consequences for your testing velocity.

Set a small effect, and you have to wait for a large sample size to know whether your results are significant. Set a larger effect, and you risk missing out on smaller improvements. Not only is this inefficient, it’s also not realistic. Most people run tests because they don’t know what might happen, and committing in advance to a hypothetical lift just doesn’t make a lot of sense.

Peeking at your results increases your error rates.

When data is flowing into your experiment in real time, it’s tempting to constantly check your results. You want to implement a winner as soon as you can to improve your business, or stop an inconclusive or losing test as early as possible so you can move on to test more hypotheses.

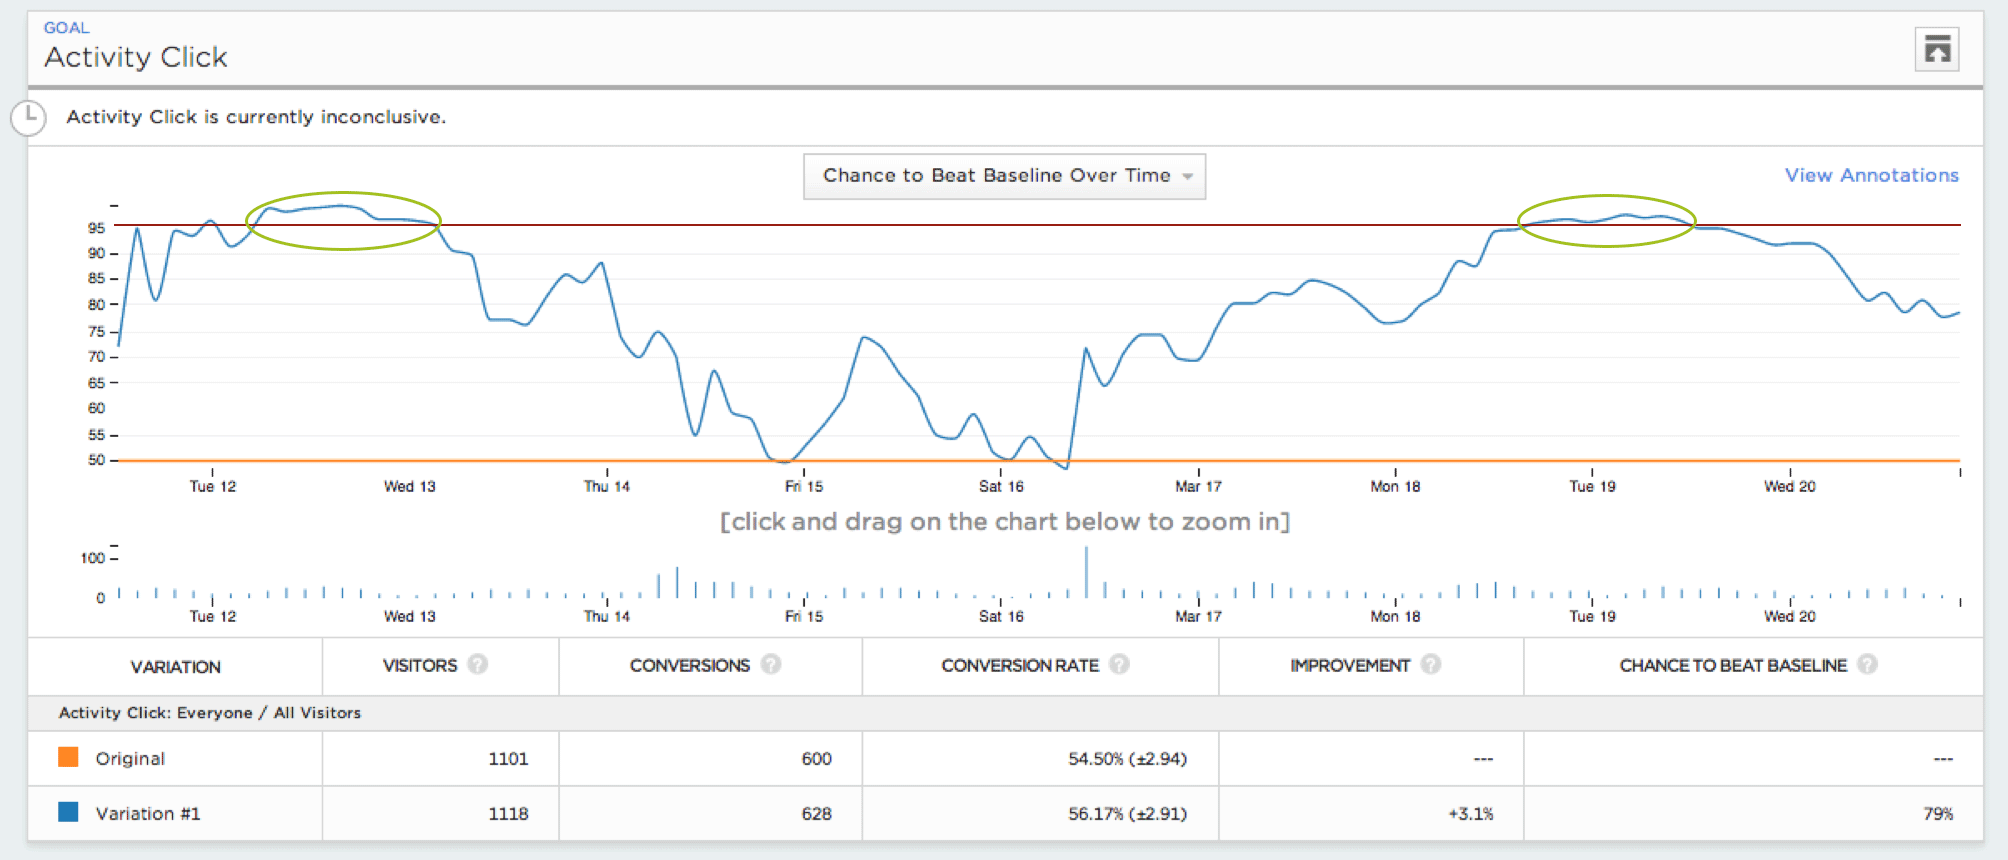
Statisticians call this constant peeking “continuous monitoring,” and it increases the chance you’ll find a winning result when none actually exists (of course, continuous monitoring is only problematic when you actually stop the test early, but you get the point.) Finding an insignificant winner is called a false positive, or Type I error.

Any test for statistical significance you run will have some chance of error. Running a test at 95% statistical significance (in other words, a t-test with an alpha value of .05) means that you are accepting a 5% chance that, if this were an A/A test with no actual difference between the variations, the test would show a significant result.

To illustrate how dangerous continuous monitoring can be, we simulated millions of A/A tests with 5,000 visitors, and evaluated the chance of making an error under different types of continuous monitoring policies. We found that even conservative policies can increase error rates from a target of 5% to over 25%.

In our investigation, more than 57% of simulated A/A tests falsely declared a winner or loser at least once during their course, even if only briefly. In other words, if you had been watching these tests, you might have wondered why your A/A test results called a winner. The increase in error rate is still meaningful even if you aren’t looking after each visitor. If you look every 500 visitors, the chance of making a false declaration increases to 26%, while looking every 1000 visitors increases the same chance to 20%.

AA-test

This graph of the statistical significance level of one A/A test over time shows where the experimenter would have seen a significant result had she been continuously monitoring the test.

Even if you’re aware of this issue, reasonable “fixes” still lead to high error rates. For example, suppose you don’t trust a significant result for your A/B test. Like many Optimizely users, you might use a sample size calculator while your test is already running to determine whether your test has run long enough. Using the calculator to adjust your sample size as the test is running is what’s called a “post-hoc calculation,” and while it mitigates some continuous monitoring risk, it still leads to error rates that hover around 25%.

Until now, the only way to protect yourself from these errors has been to use the sample size calculator before beginning your test, then wait until your test reaches your sample size before making decisions based on your results.

The good news is that there’s actually a pretty simple yet elegant statistical solution that lets you see results that are always valid, any time you peek, without needing to guess at a minimum detectable effect in advance. It’s called sequential testing, and we’ll discuss it in more detail later.

Testing many goals and variations at once leads to more errors than you might think.

Another pitfall of using traditional statistics involves testing many goals and variations at once (the “multiple comparisons” or “multiple testing problem.”) This happens because traditional statistics controls errors by controlling for false positive rate. Yet this error, the one you set in your significance threshold, does not match the chance of making an incorrect business decision.

The error rate you really want to control to correct for the multiple testing problem is the false discovery rate. In the example below, we show how controlling for a 10% false positive rate (90% statistical significance) can lead to a 50% chance of making an incorrect business decision due to false discovery.

Consider testing 5 variations of your product or website, which each have 2 goals as success metrics. One of these variations outperforms the baseline and is correctly declared a winner. By random chance alone, we would expect to see about one more variation falsely declared a winner (10% of the 9 remaining goal-variation combinations). We now have 2 variations that are declared winners.

Even though we controlled for a 10% false positive rate (1 false positive), we have a much higher (50%) ratio of spurious results to good ones, greatly increasing the chance of making the wrong decision.

In this experiment, there are two winners out of ten goal-variation combinations tested. Only one of these winners is actually different from the baseline, while the other is a false positive.

In this experiment, there are two winners out of ten goal-variation combinations tested. Only one of these winners is actually different from the baseline, while the other is a false positive.

Controlling for false positive rate is dangerous because the experimenter is unknowingly penalized for testing many goals and variations. If you’re not careful, you’ll take on more practical risk than you’re aware of. To avoid this problem in traditional A/B testing, you must always keep in mind the number of experiments that are running. One conclusive result from 10 tests is different than one from 2 tests.

Fortunately, there is a principled way to make the error rate of your experiment match the error rate you think you are getting. Stats Engine accomplishes this by controlling errors known as false discoveries. The error rate you set in your significance threshold with Stats Engine will reflect the true chance of making an incorrect business decision.

How Stats Engine works

Stats Engine combines innovative statistical methods to give you trustworthy data faster.

We’ve heard from our customers over the past four years about the above problems, and we knew there had to be a better way to solve them than a sample size calculator and more educational articles.

We partnered with Stanford statisticians to develop a new statistical framework for A/B testing that is powerful, accurate and, most importantly, effortless. This new Stats Engine is composed of two methods: sequential testing and false discovery rate controls.

Sequential Testing: Make decisions as soon as you see a winner.

In contrast to Fixed Horizon testing, which assumes that you will only evaluate your experiment data at one point in time, at a set sample size, sequential testing is designed to evaluate experiment data as it is collected. Sequential tests can be stopped any time with valid results.

Experimenters rarely have a fixed sample size available, and their objective is typically to get a reliable inference as quickly as possible. Stats Engine meets these goals with an implementation of sequential testing that calculates an average likelihood ratio—the relative likelihood that the variation is different from the baseline—every time a new visitor triggers an event. The p-value of a test now represents the chance that the test will ever reach the significance threshold that you select. It’s the analogue of a traditional p-value for a world where your sample size is dynamic. This is called a test of power one, and it is a better fit than a traditional t-test for the objective of A/B testers.

sequential-testing-graphic

This means you get reliable, valid inferences as soon as they’re available without having to set a minimum detectable effect in advance or wait to reach a fixed sample size.

False Discovery Rate Control: Test many goals and variations with guaranteed accuracy.

Reporting a false discovery rate of 10% means that “at most 10% of winners and losers have no difference between variation and baseline,” which is exactly the chance of making an incorrect business decision.

With Stats Engine, Optimizely now reports winners and losers with low false discovery rate instead of low false positive rate. As you add goals and variations to your experiment, Optimizely will correct more for false discoveries and become more conservative in calling a winner or loser. While fewer winners and losers are reported overall (we found roughly 20% fewer in our historical database*), an experimenter can implement them with full knowledge of the risk involved.

When combined with sequential testing, false discovery rate control provides an accurate view of your chance of error anytime you look at test results. The control gives you a transparent assessment of the risk you have of making an incorrect decision.

This means you can test as many goals and variations as you want with guaranteed accuracy.

* On a large, representative sample of historical A/B tests by Optimizely customers, we found that there were roughly 20% fewer variations with false discovery rate less than .1 compared to false positive rate at the same level.

How it’s better

Optimizely’s Stats Engine reduces errors without sacrificing speed.

We re-ran 48,000* historical experiments with Stats Engine and the results are clear: Stats Engine provides more accurate and actionable results without sacrificing speed.

Have more confidence in your winners and losers.

Fixed Horizon statistics declared a winner or loser in 36% of tests (when the test was stopped.) In this same data set, Stats Engine declared winners or losers in 22% of tests.

Stats Engine uncovered 39% fewer conclusive test results than traditional statistics. While this number may be alarming, (and at first it alarmed us too!) we found that many of these dropped experiments were likely stopped too early.

To come to this result, we used a similar methodology to what customers use when they manipulate the sample size calculator to determine whether a test has power (the probability that you will detect an effect if one actually exists) after it starts—a post-hoc power calculation. Running underpowered tests suggests that there is not enough information in the data to strongly distinguish between false positives and true positives. Using 80% as our standard of power, most (80%) of the experiments that Stats Engine no longer called conclusive were underpowered while most (77%) of the experiments that Stats Engine kept were powered.

Stable recommendations you can trust.

Fixed Horizon statistics changed its declaration of winner or loser in 44% of our historical experiments. Stats engine changed declarations in 6% of these tests.

With Fixed Horizon statistics, you could see a winner one day, and an inconclusive result the next. The only valid declaration was the one at your pre-determined sample size. With Stats Engine, results are always valid and unlikely to change a conclusive result.

With Stats Engine, false positive rate dropped from >20% to <5%.

Recall our A/A test simulations (each test ran to 5000 visitors) when we discussed the dangers of peeking. In those simulations, we ran tests at 95% significance and found:

  • If you looked at the results after each new visitor the experiment, there is a 57% chance of declaring a winner or loser.
  • If you looked every 500 visitors, there is a 26% chance of a false declaration.
  • If you looked every 1000 visitors, there is a 20% chance of a false declaration.
  • With sequential testing (looking after each visitor), this same error number drops to 3%.

If we run these simulations to higher sample sizes (say 10,000 or even 1,000,000 visitors), the chance of a false declaration with traditional statistics increases (easily over 70% depending on sample size) regardless of how often you look at your results. With sequential testing, this error rate also increases but is upper bounded at 5%.

There’s no catch: Accurate and actionable results don’t need to sacrifice speed.

So reading this far, you may ask: What’s the catch? There isn’t one.

Here’s why: Choosing a proper sample size means picking a minimum detectable effect in advance. As discussed earlier, that’s a difficult task. If for every experiment (before you ran it), you set the MDE within 5% of the actual lift of the experiment, the sequential test will be on average 60% slower.

However, in reality, practitioners choose an MDE that is designed to be lower than observed lifts. It reflects the longest they are willing to run an experiment. With Stats Engine, when the true lift is larger than your MDE, you’ll be able to call your test faster.

We found that if the lift of your A/B test ends up 5 percentage points (relative) higher than your MDE, Stats Engine will run as fast as Fixed Horizon statistics. As soon as the improvement exceeds the MDE by as much as 7.5 percentage points, Stats Engine is closer to 75% faster. For larger experiments (>50,000 visitors), the gains are even higher and Stats Engine can call a winner or loser up to 2.5 times as fast.

The ability to make tests run in a reasonable amount of time is one of the hardest tasks in applying sequential testing to A/B testing and optimization. Our large database of historical experiments enables us to tune Stats Engine from prior information. By leveraging our extensive experiment database, Optimizely can deliver the theoretical benefits of sequential testing and FDR control without imposing practical costs.

*A note on the data: The data set we tested had experiments with a median of 10,000 visitors. Tests with a lower number of visitors had a lower number of declarations in both Fixed Horizon Testing and Stats Engine, a similar number of changed declarations, but we’re quicker to show speed gains for sequential testing.

What this means for every test run until today

Let’s clarify one thing: Traditional statistics do control error at expected rates when used properly. That means that if you’ve been using a sample size calculator and sticking to its recommendations, you probably don’t need to worry about tests you ran in the past. Similarly, if you tend to make business decisions based only on primary conversion metrics, the difference between your false discovery and false positive rate is reduced. For Optimizely users who were already taking these precautions, Stats Engine will provide a more intuitive workflow and reduce the effort involved in running tests.

We also know that there are a lot of people out there who probably weren’t doing exactly what the sample size calculator told you to do. But digital experimenters are a savvy and skeptical bunch. You might have waited a set number of days before calling results, waited longer if things looked fishy or re-run your sample size calculation each time you peeked to see how much longer to wait. All of these practices do help combat the chance of making an error. While your error rate is likely higher than 5%, it also probably wouldn’t be over 30%. If you fall into this group, Stats Engine frees you from these practices and instead provides you accurate expectations about the error rates you can expect.

One small step for Optimizely, one giant leap for online optimization

Optimizely’s mission is to enable the world to turn data into action. Five years ago, we took our first stride toward this mission by making A/B testing accessible to non-engineers with our Visual Editor. Now, tens of thousands of organizations have embraced a philosophy of integrating data into every decision.

Today, with Stats Engine, we want to take the industry one step further by removing yet another barrier to becoming a data-driven organization. By empowering anyone to analyze results with powerful statistics, we aim to empower businesses to support even more important decisions with data.

Getting statistics right is essential to making data-driven decisions, and we’re committed to evolving our statistics to support our customers. We can’t wait to work with you to write the next chapter of online optimization.

We’re looking forward to your feedback and thoughts on statistics. Let us know what you think in the comments!

Want to learn more? We’ve created a number of additional resources to help you get up to speed on statistics with Optimizely: