Ratio metrics are calculated metrics that measure the relationship between two different events in a single metric. Unlike simple metrics, which automatically normalize by the number of users in a variation, ratio metrics allow you to define a custom denominator, giving you the flexibility to construct measurements that directly align with how your business evaluates performance.
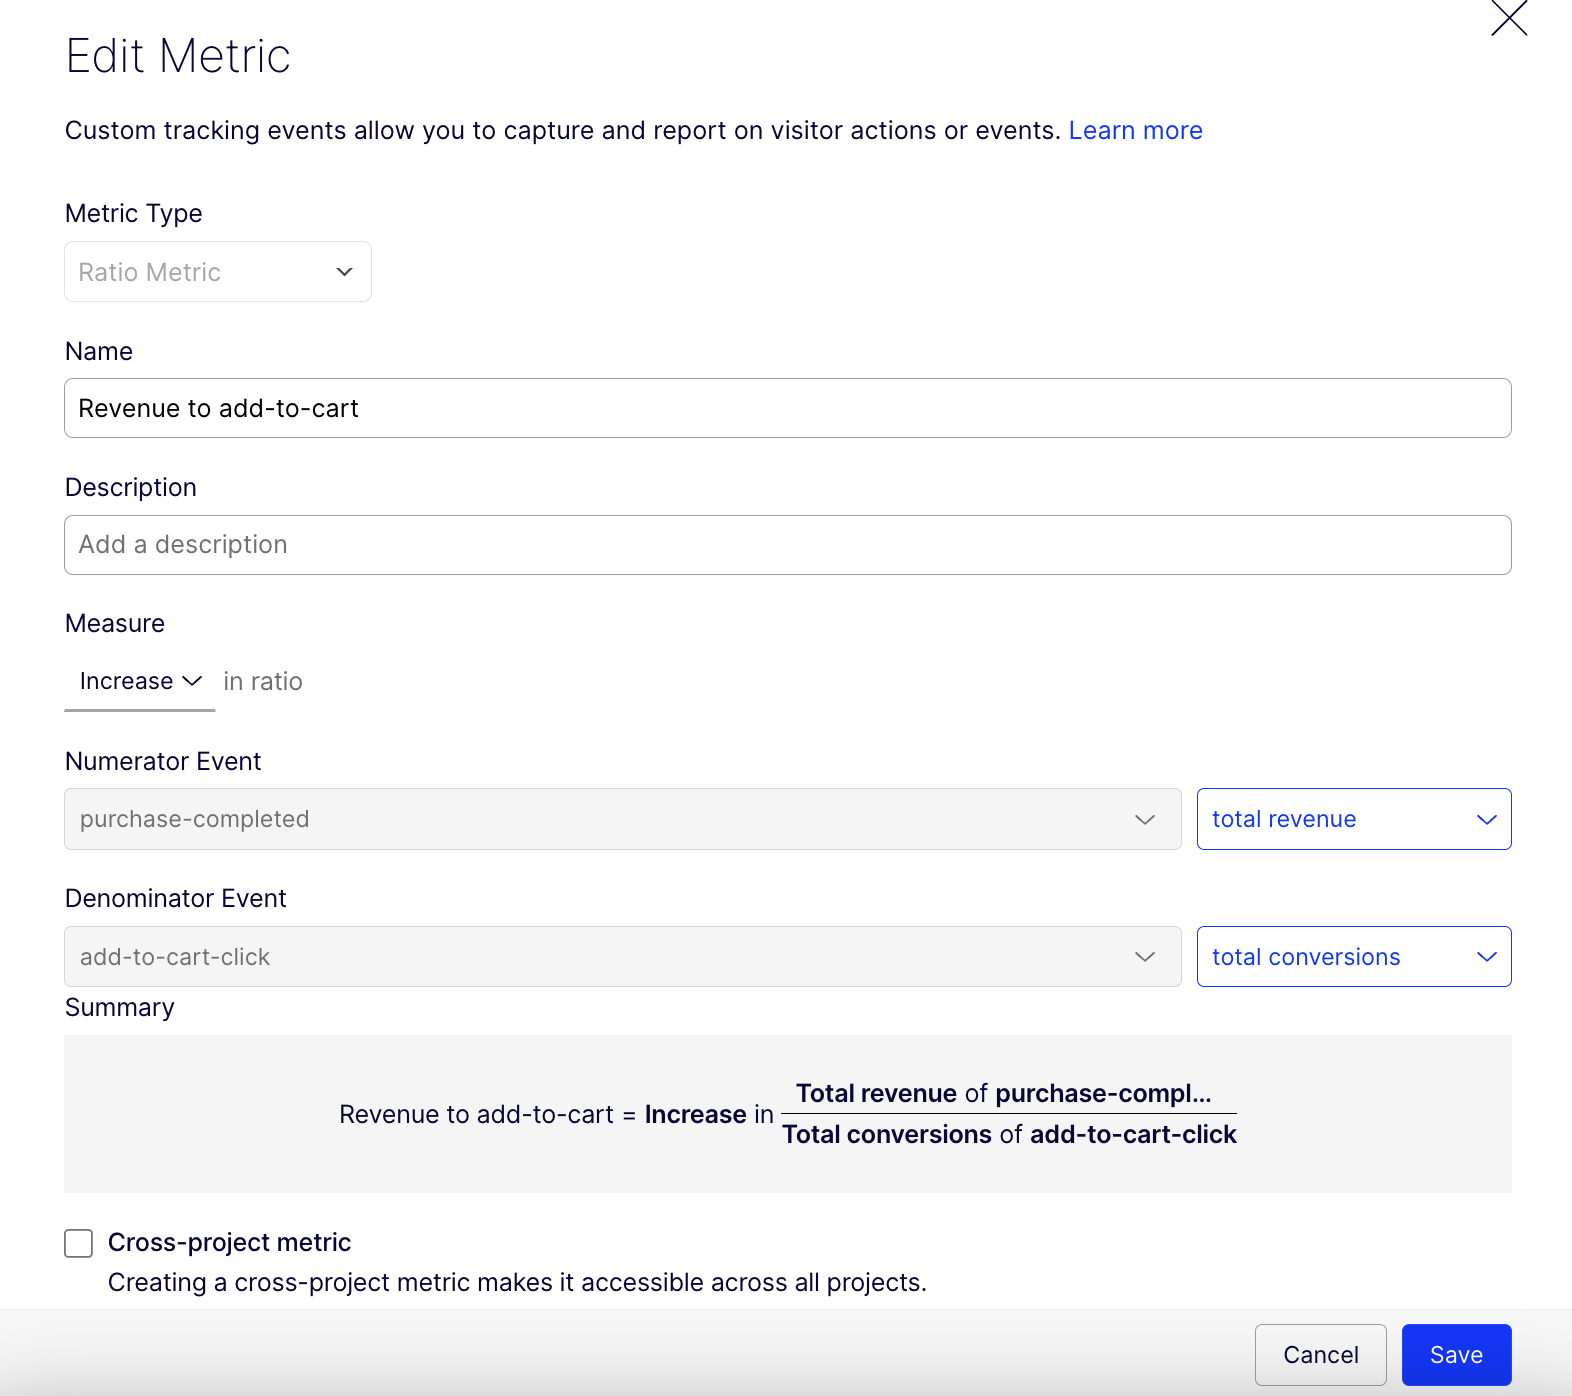
By dividing one event's total count, unique count, total revenue, or total value by another event's corresponding aggregation, ratio metrics enable you to create advanced measurements such as "revenue per add-to-cart click," "feature adoption per account," or "average order value."
Ratio metrics provide the flexibility to construct measurements that better reflect how your business evaluates performance. They allow you to create custom metrics that align with established KPIs, bringing business logic directly into your experimentation platform.
This alignment bridges the gap between experimentation data and the metrics stakeholders care about most, making your experiment results more actionable and relevant to business decisions.
Note: Ratio metrics are available in Web Experimentation (WX), Feature Experimentation (FX), and Optimizely Analytics products.
Image source: Optimizely
But, is there any difference between ratio metrics and simple metrics?
Simple metrics are more straightforward to analyze and interpret, making them ideal when they adequately capture what you're measuring. Ratio metrics offer valuable flexibility when you need to align experimentation with established business KPIs that are already expressed as ratios.”
How ratio metrics work
Ratio metrics provide valuable flexibility when you need measurements that reflect your established business KPIs. Many organizations already use ratio-based metrics in their daily operations, and ratio metrics allow you to bring these same measurements into your experimentation program.
The calculation process follows a specific methodology. First, the system checks if a user completes the denominator event. If the denominator event occurred, it then looks for numerator events for the same user within a 48-hour window. It counts it on the per-user level and then aggregates the ratio from a per-user ratio. The system aggregates values for the numerator events, summing values for the numeric-based events or counting occurrences for count-based events. It then calculates the ratio per unit and averages across all qualifying units.
Also, ratio metrics can serve as primary, secondary, or monitoring metrics in your experiments, depending on how well they align with your business objectives and experimental goals.
When to use ratio metrics
Ratio metrics are particularly powerful in several scenarios. Use them when you need to measure efficiency or value per event rather than per user, when your key performance indicator is already expressed as a ratio (like revenue per session or purchases per account), or when you want to create funnel-like metrics to analyze sequential event relationships.
These metrics excel at bridging the gap between experimentation data and established business KPIs. For instance, instead of tracking simple revenue per user, you might measure revenue per add-to-cart click to understand the efficiency of your cart additions in generating revenue.
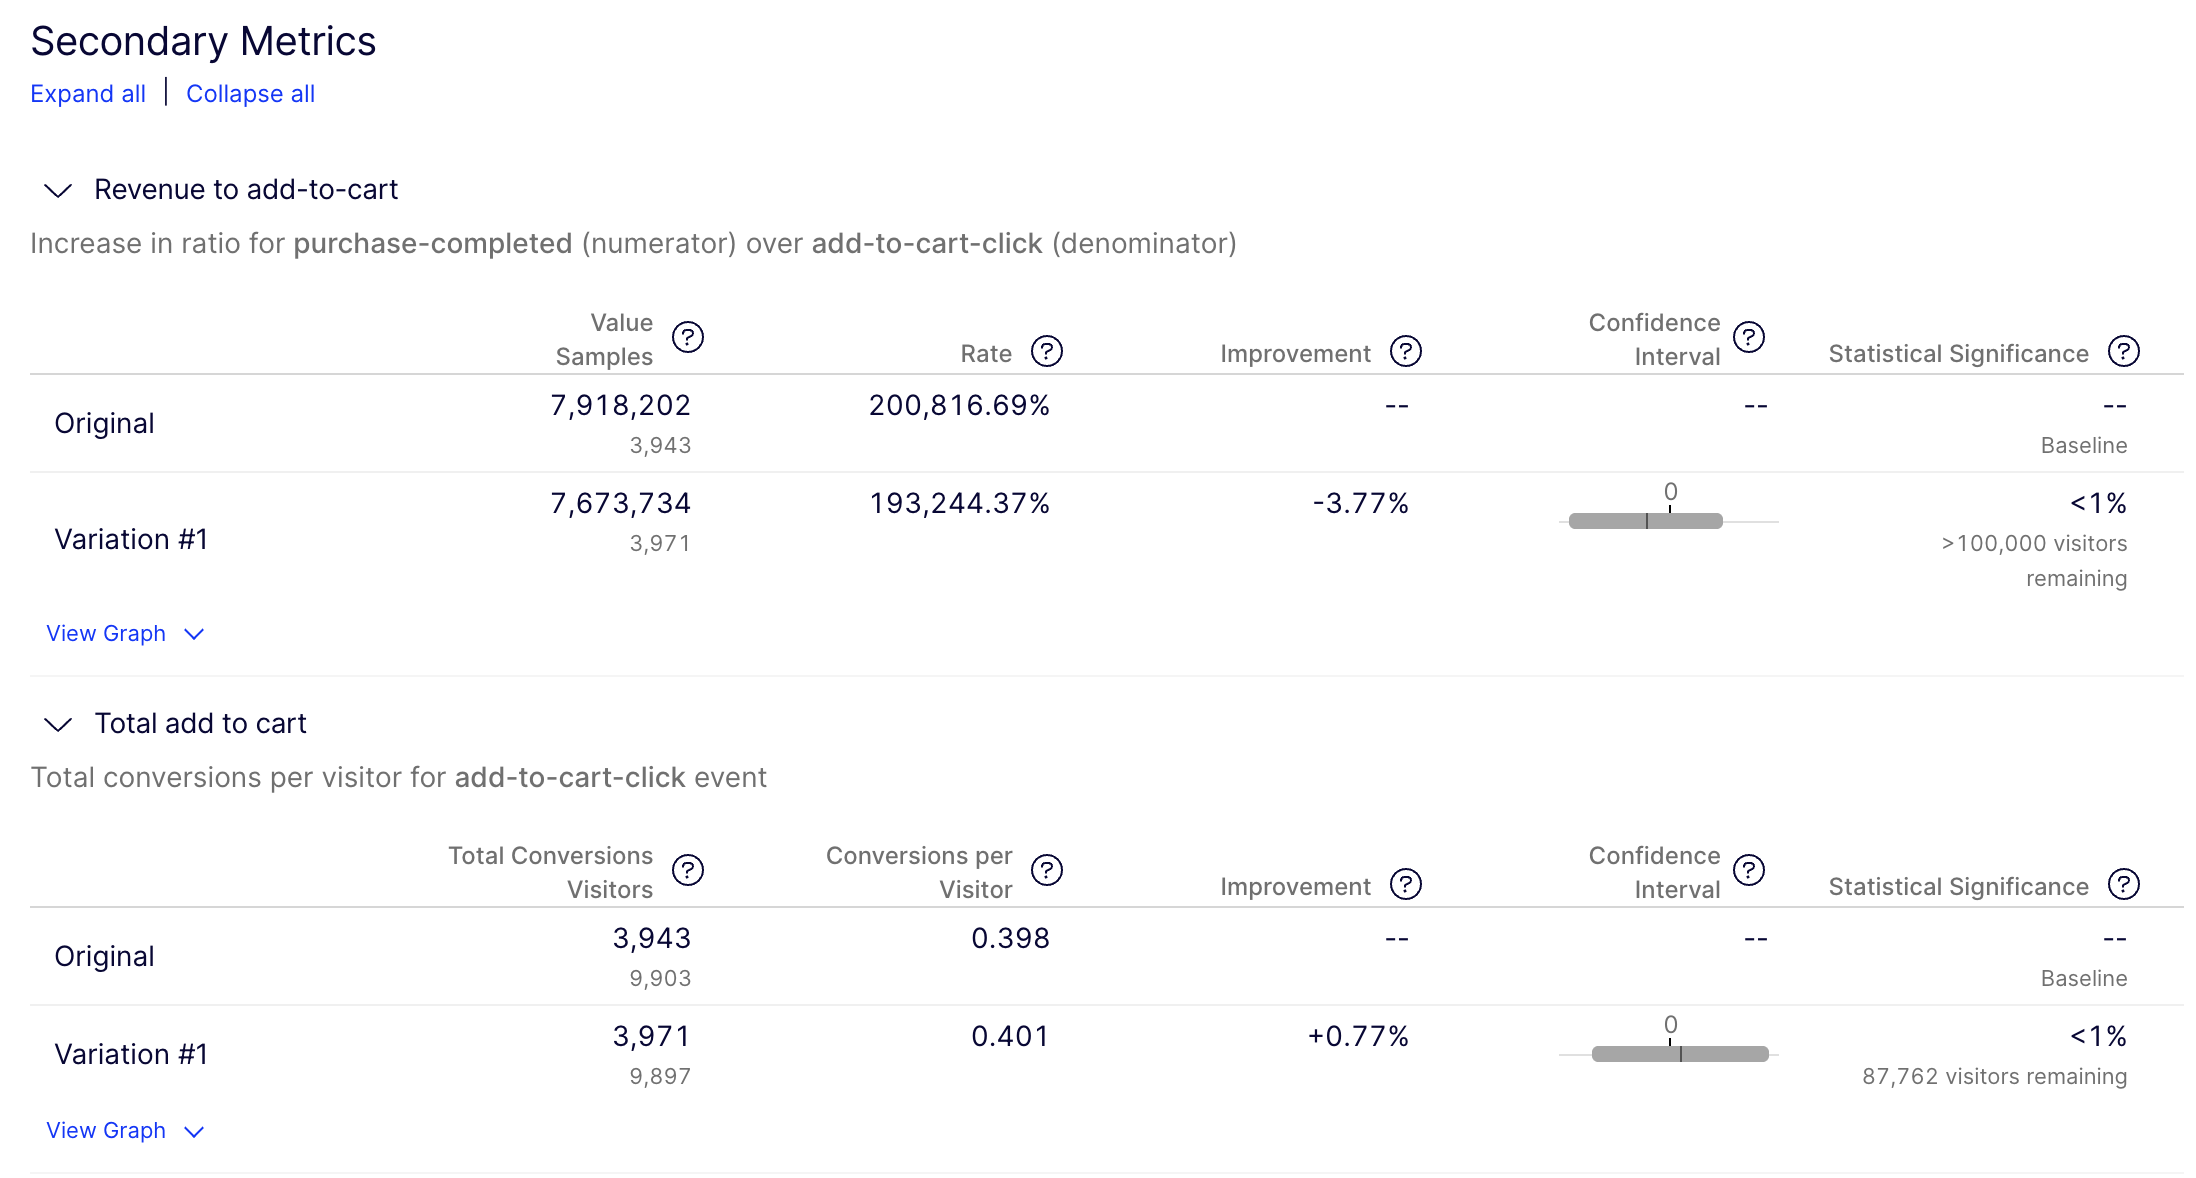
Image source: Optimizely
Ratio metrics examples
- E-commerce optimization: Track "Revenue per Add-to-Cart Click" instead of revenue per user. This helps you understand if product page improvements drive higher-value purchases when users engage, even if click rates remain stable.
- B2B SaaS platforms: For enterprise software with multiple users per company, measure "Feature Adoption per Account" rather than per user. This reveals organizational adoption patterns instead of individual usage.
- Streaming services: Instead of measuring watch time per user, track "Total Watch Time per Household Account." This provides insights into content engagement at the subscription level, directly impacting retention decisions.
- Marketing funnels: Create metrics like "Form Submissions per Banner Click" to assess conversion efficiency at specific touchpoints and understand the conditional relationship between connected events.
Statistical considerations for ratio metrics
Ratio metrics require careful statistical handling due to their complex nature. Since they involve two events, determining statistical significance requires estimating the metric's variance using a first-order Taylor series approximation (the Delta method).
The statistical methodology accounts for the fact that the two events in a ratio metric may not be independent—their values can be statistically dependent, meaning changes in one event could correlate with changes in the other. This dependence is captured in the variance calculation to ensure accurate statistical inferences.
Best practices for implementing ratio metrics
-
Always include component metrics: Add the numerator and denominator as separate simple metrics in the same experiment. This provides essential context for interpreting ratio changes and helps identify when ratios become skewed due to dramatic changes in only one component.
-
Watch for misleading signals: You can improve the ratio by decreasing the denominator while the numerator remains unchanged. For example, "revenue per visit" might show improvement because visits decreased, not because revenue improved.
-
Choose the right metric type: Start with simple metrics when they adequately capture your goal. Use ratio metrics when a custom denominator is essential for aligning with business KPIs.
-
Analyze in context: Use your analytics dashboard to understand how both the numerator and denominator behave to grasp what's driving changes in your ratio metric.
Wrapping up...
Ratio metrics bridge the gap between experimentation data and real business performance by allowing you to measure what matters most to your organization.
When implemented thoughtfully, with careful attention to component metrics and alignment with established KPIs, they transform experimental insights into actionable business intelligence.
The key lies in choosing the right metric type for your specific goals and interpreting results within the broader context of your business objectives.