ROADMAP & RELEASES
Latest updates for Analytics
From warehouse-native to advanced visualizations, here's everything you need to know about what's coming to Optimizely Analytics.
Now streaming!
Our Summer '25 Product Roadmap Series.
Get a first look at what’s coming from Optimizely, shared by our product leaders in a fresh, on-demand format. The perfect fit for your busy summer schedule!
Start with the ultimate Optimizely One Intro to the Series which even includes some Opticon teasers. Then head over to our sessions which span all the hottest topics of the summer: AI, Analytics, Testing & Personalization, Content, and Commerce.
And now on to our product updates...
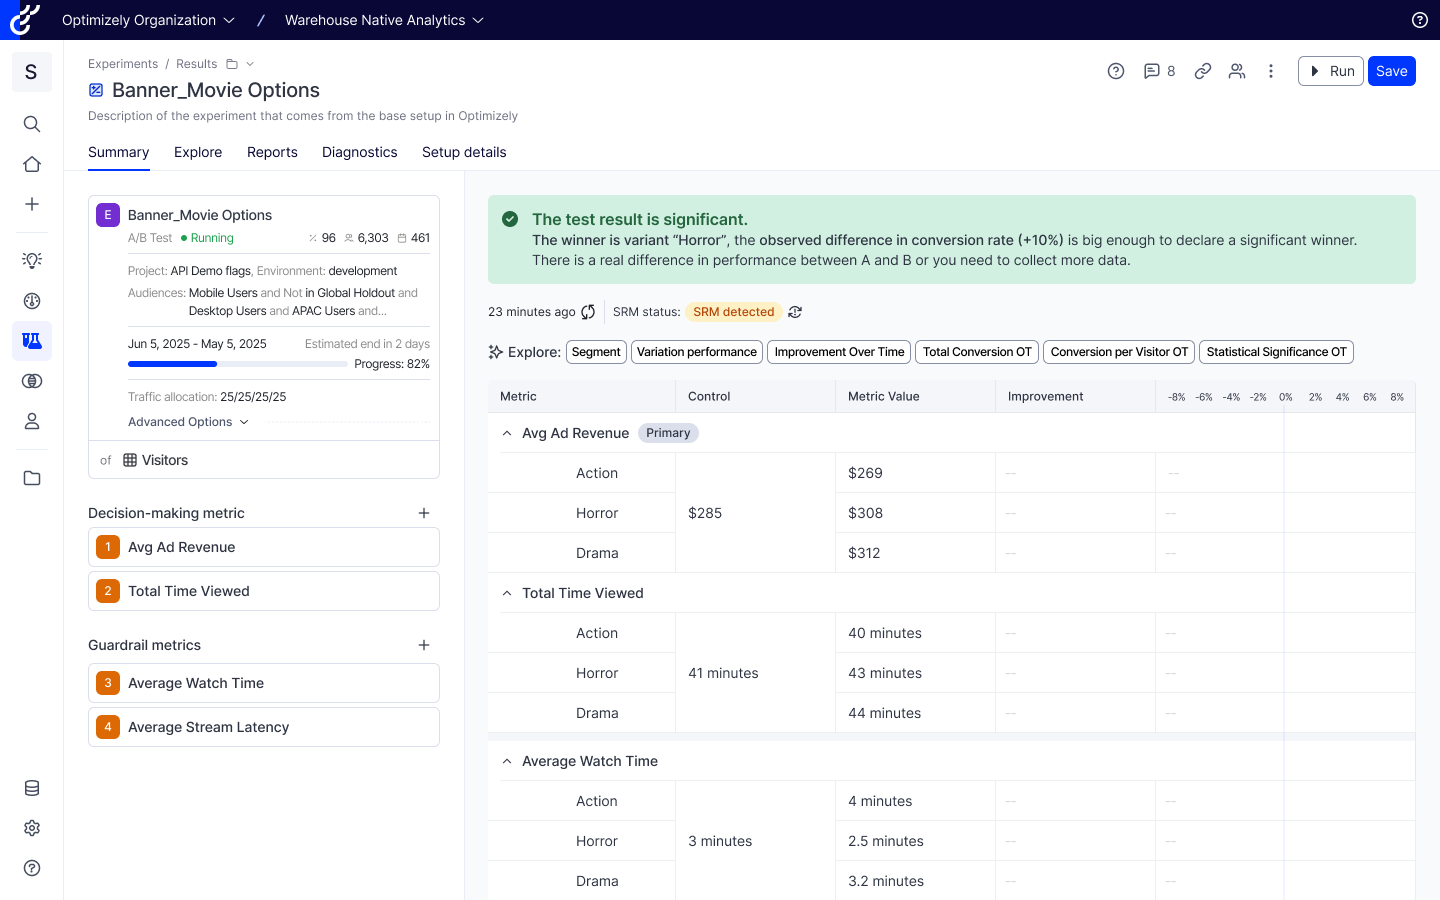
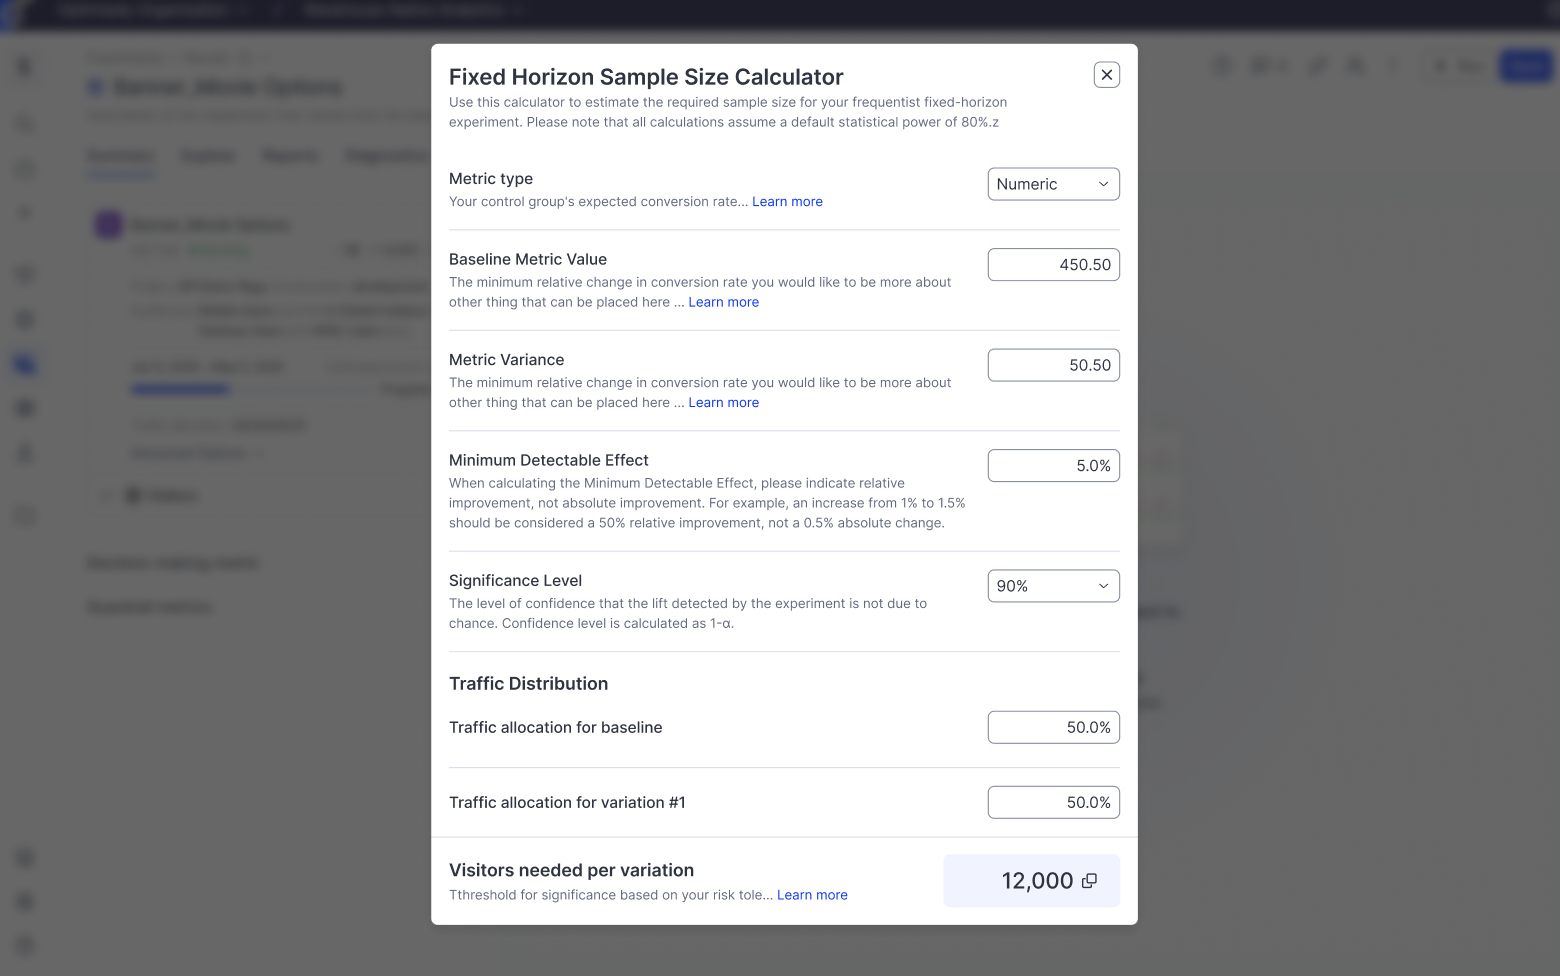
'Fixed Horizon' Stats Engine
For experiments that require a specific sample size and only allow results to be reviewed once that sample is reached, the Fixed Horizon Stats Engine provides a reliable and auditable approach. This method is ideal for teams operating in regulated environments or those with fixed-duration testing requirements.
Key benefits:
-
Ensures statistical rigor with a traditional and well-established approach
-
Supports pre-defined test durations
-
Enables consistent, auditable analysis
Images are for illustrative purposes and subject to change.
Bayesian Stats Engine
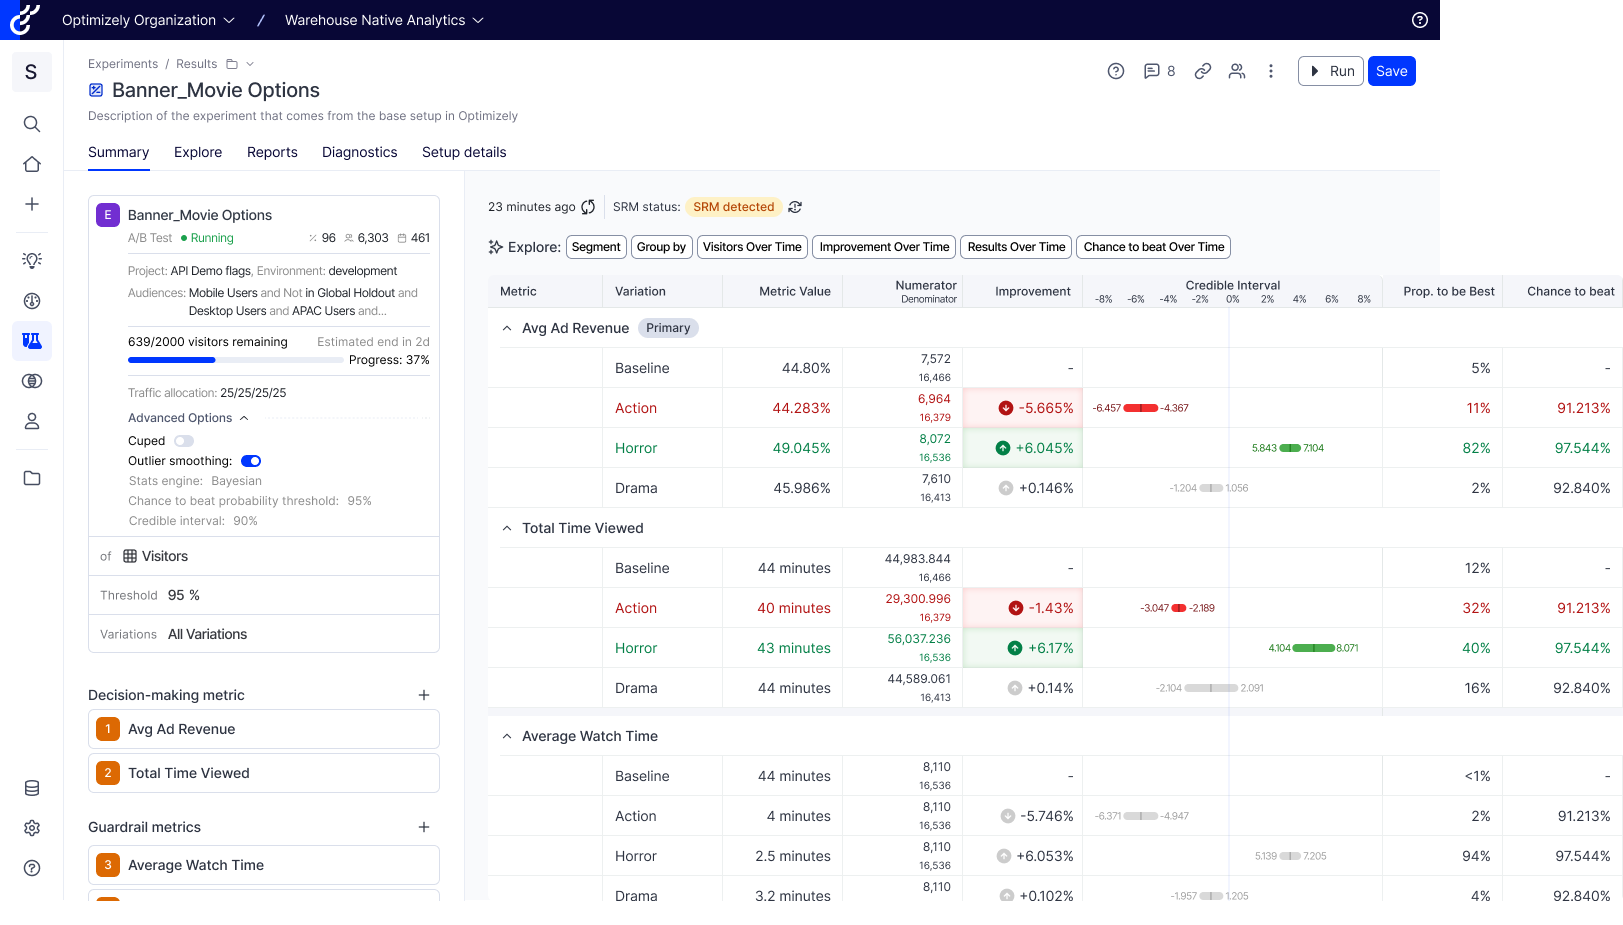
The Bayesian Stats Engine interprets probability in an intuitive, decision-focused way—answering questions like “how likely is this variation to be better?” It’s ideal for teams who want faster insights, continuous monitoring, and the flexibility to incorporate prior knowledge into their analysis.
Key benefits:
-
Enables continuous monitoring without increasing false positives
-
Presents results in a clear, probability-based format
-
Allows integration of prior information to reach significance faster
Images are for illustrative purposes and subject to change.
Guardrail Alerts
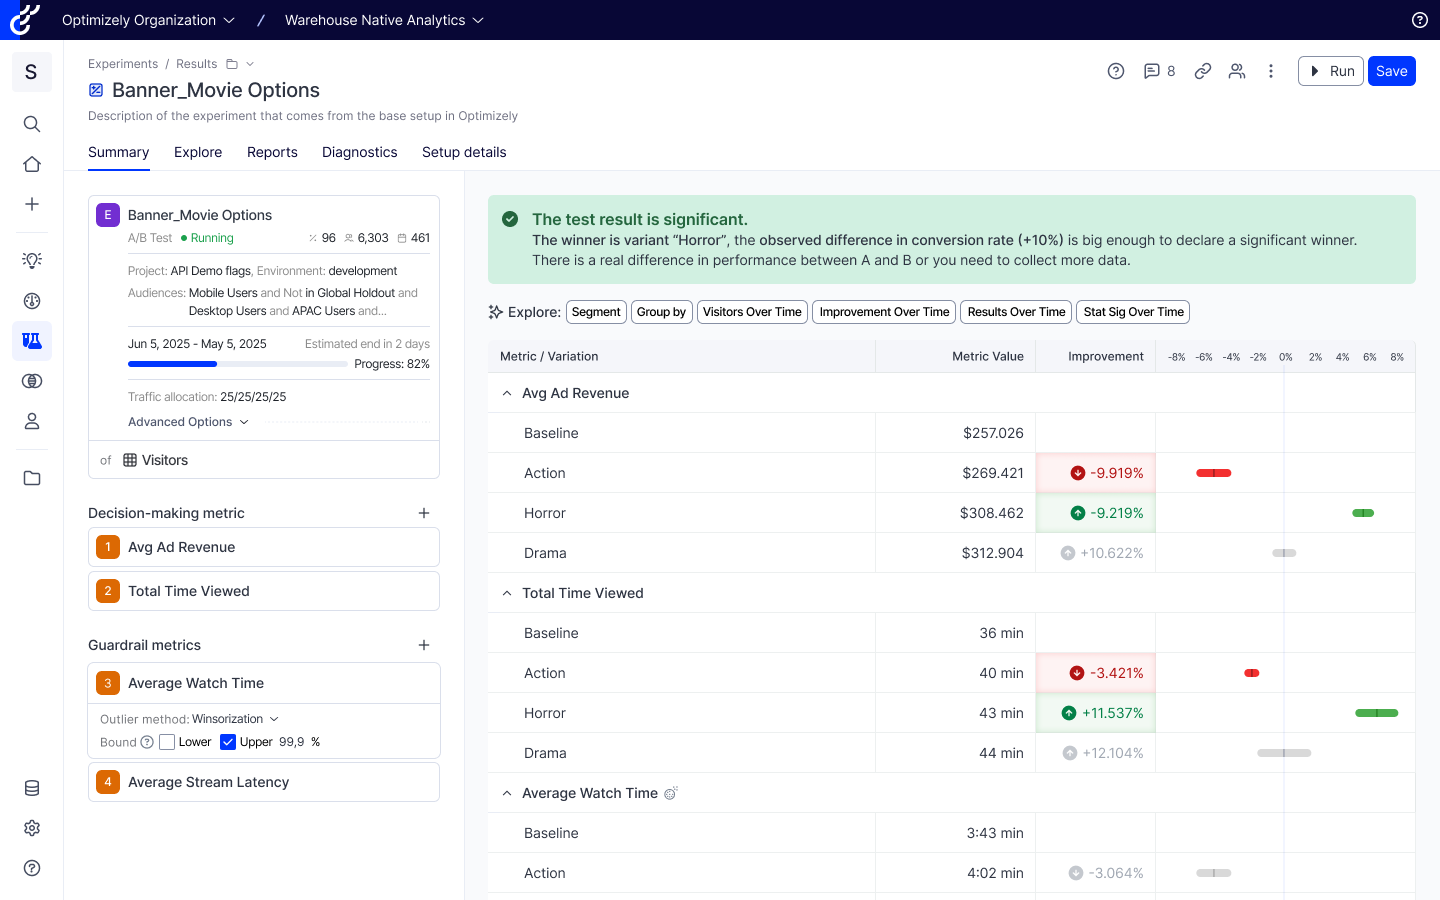
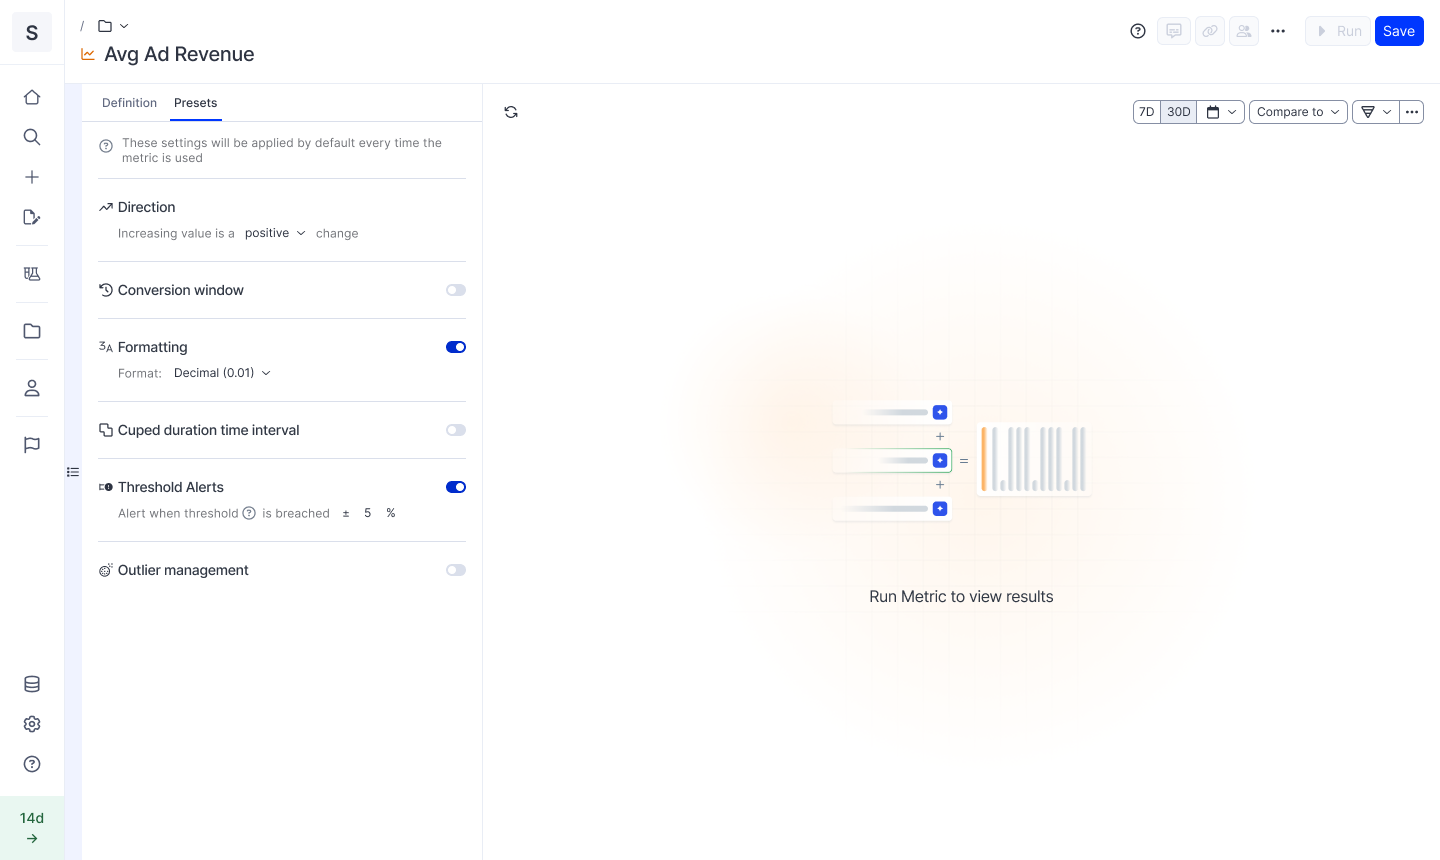
Guardrail Alerts notify you when a key metric declines beyond a set threshold during an experiment. Often tied to guardrail metrics like site speed or signups, these alerts help prevent negative outcomes and enable fast, proactive decision-making.
Key benefits:
-
Proactive monitoring of guardrail metrics
-
Timely notifications when metrics fall outside acceptable ranges
-
Usable across the platform to safeguard critical KPIs
Images are for illustrative purposes and subject to change.
Categories
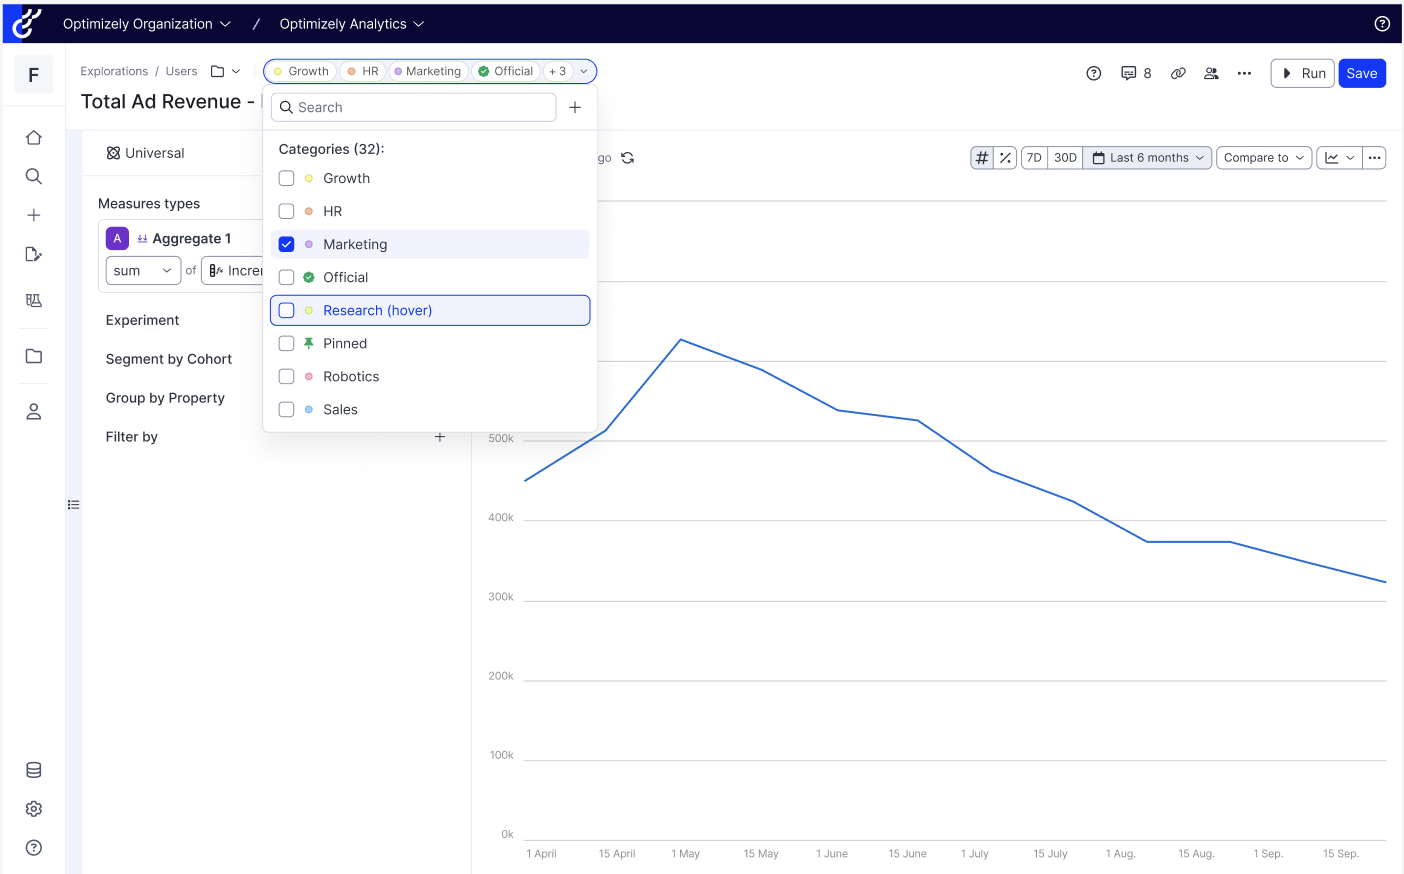
Quickly organize your workspace by grouping related assets like dashboards, events, and explorations—making everything easier to find, manage, and govern.
Key benefits:
- Group related dashboards, explorations, and events under shared categories to reduce clutter and help teams navigate growing data environments.
- Assign categories by team, product, or status (e.g., “Verified”) to establish clear ownership and enforce consistent governance.
- Help users quickly find what they need by enabling filtering and search by category—no more digging through disconnected assets.
Images are for illustrative purposes and subject to change.
Favorites
Mark key entitles (explorations, dashboards, etc.) as favorites to keep them easily accessible, so you can quickly return to the insights you use most, without digging through folders or search.
Key benefits:
- Instantly open your go-to dashboards and explorations.
- Skip search and navigation for frequently used assets.
- Focus your view around what matters most to you.

Images are for illustrative purposes and subject to change.
Save Blocks in Line
Save metrics, cohorts or derived columns directly from an exploration without needing to recreate it.
Key benefits:
- Increases productivity.
- Reduces recreating entitles you've already created
- Reduces copying and pasting
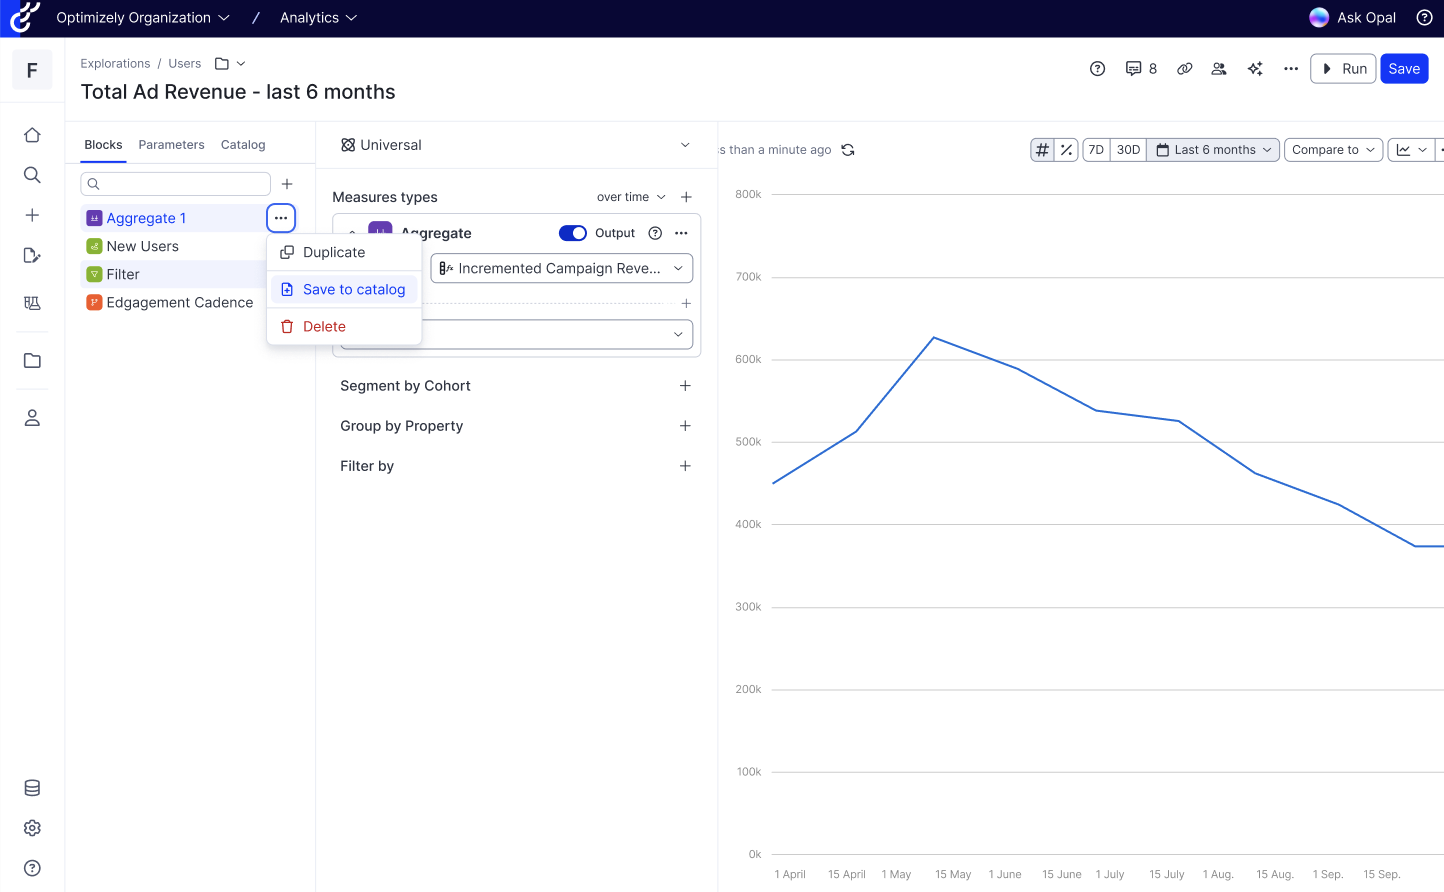
Images are for illustrative purposes and subject to change.
Opal Chat
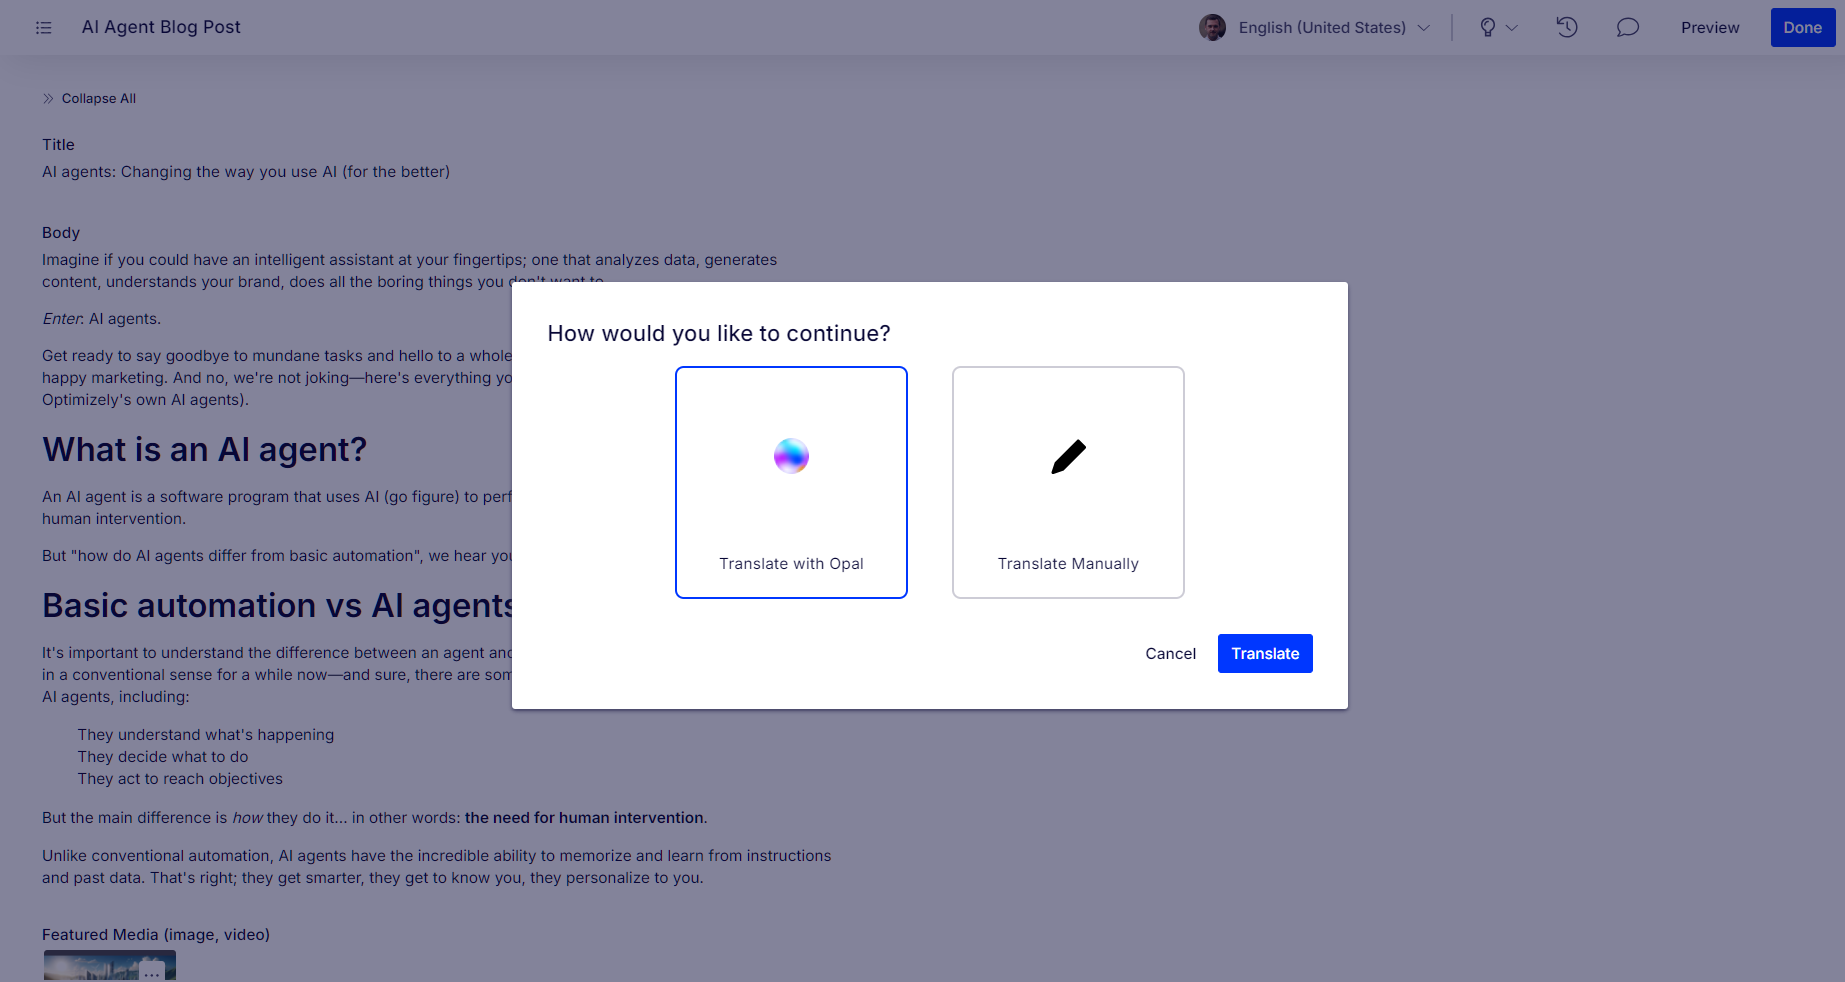
Opal is your always-on AI data partner—designed to make analytics faster, easier, and more intuitive. From answering questions about how to configure data sets to summarizing explorations, Opal helps you get to insights faster—no SQL required.
Key benefits:
- Lowers the barrier to entry by enabling anyone to explore data without knowing the data
- Empowers non-analysts to uncover insights without manual setup
- Accelerates discovery of trends, patterns, and anomalies through smart, auto-generated explorations
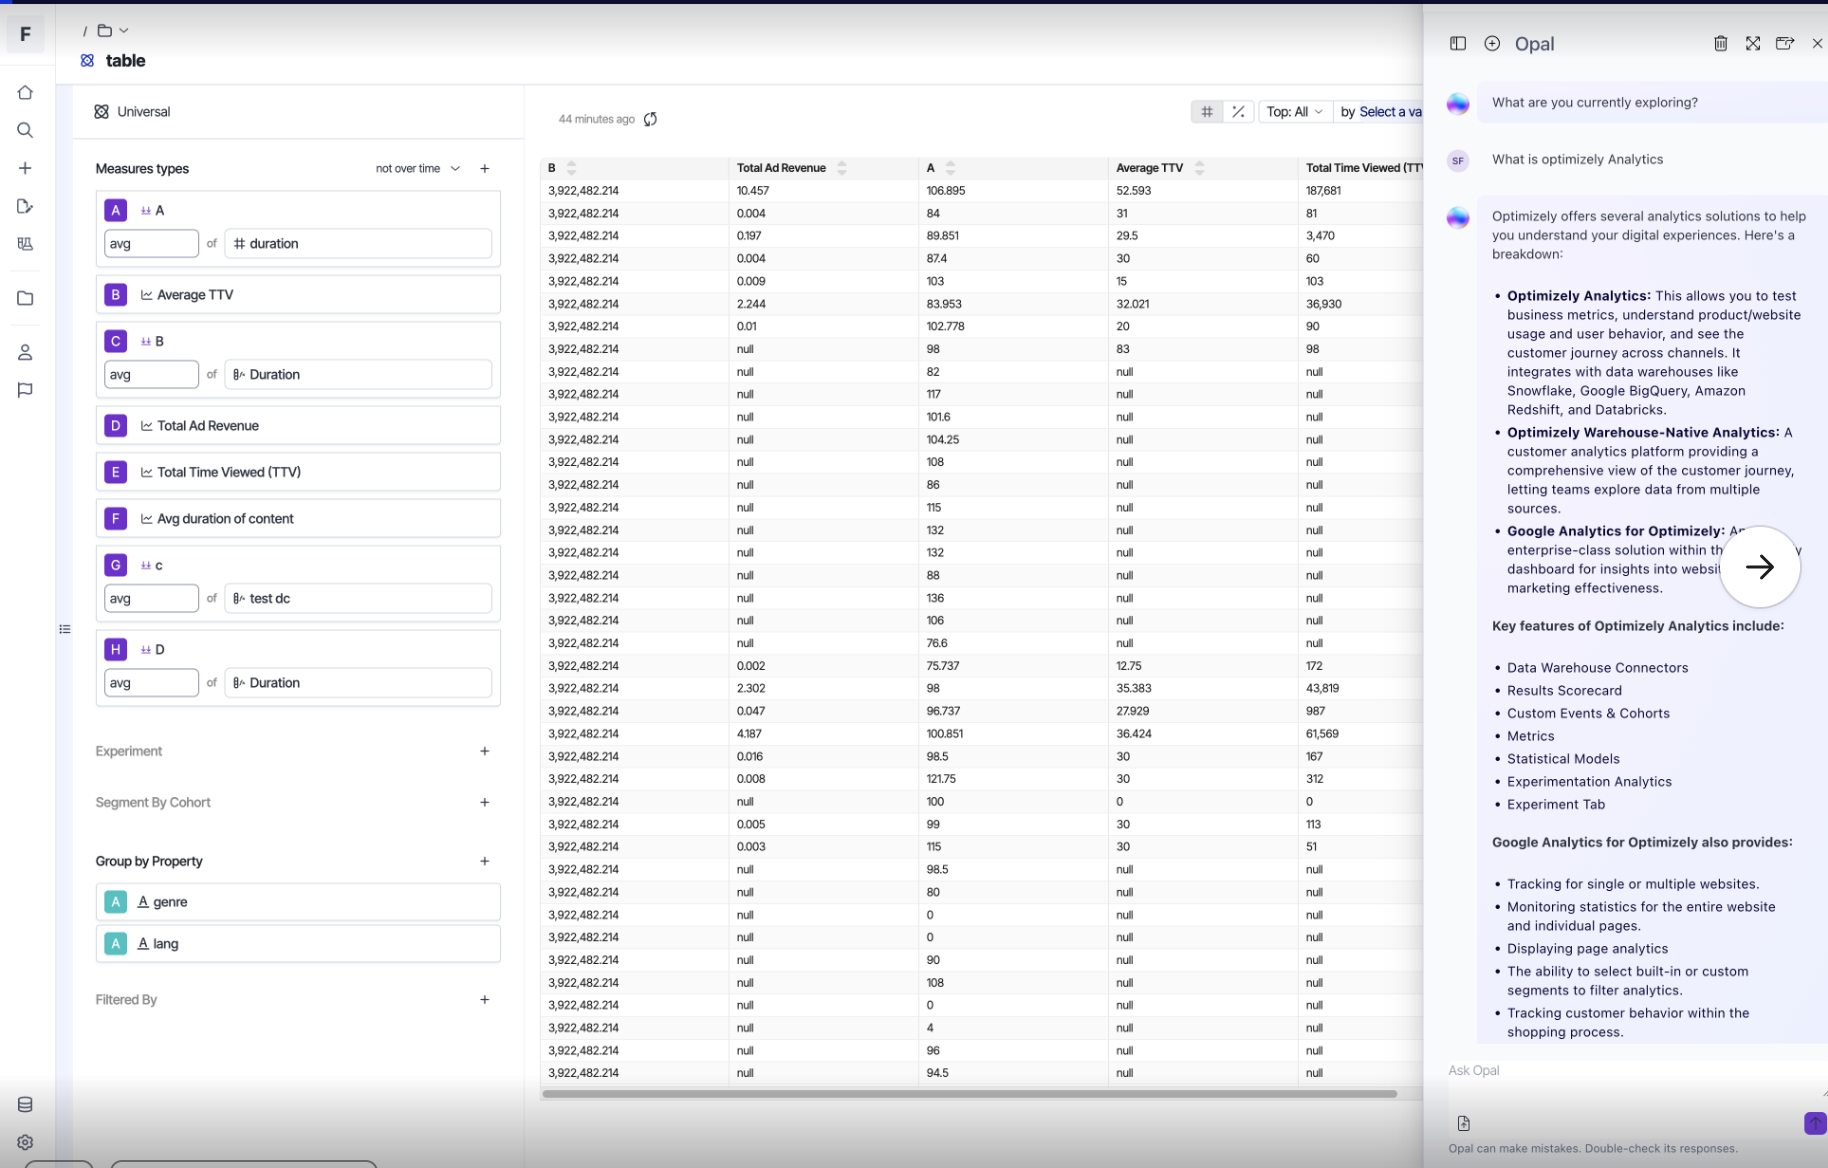
Images are for illustrative purposes and subject to change.
Metric Groups
Group your core metrics into a single category so teams can apply them to new experiments in one click—instead of manually selecting the same metrics each time.
Key benefits:
- Simplified metric management
- Improved ease of use
- Reduced manual effort
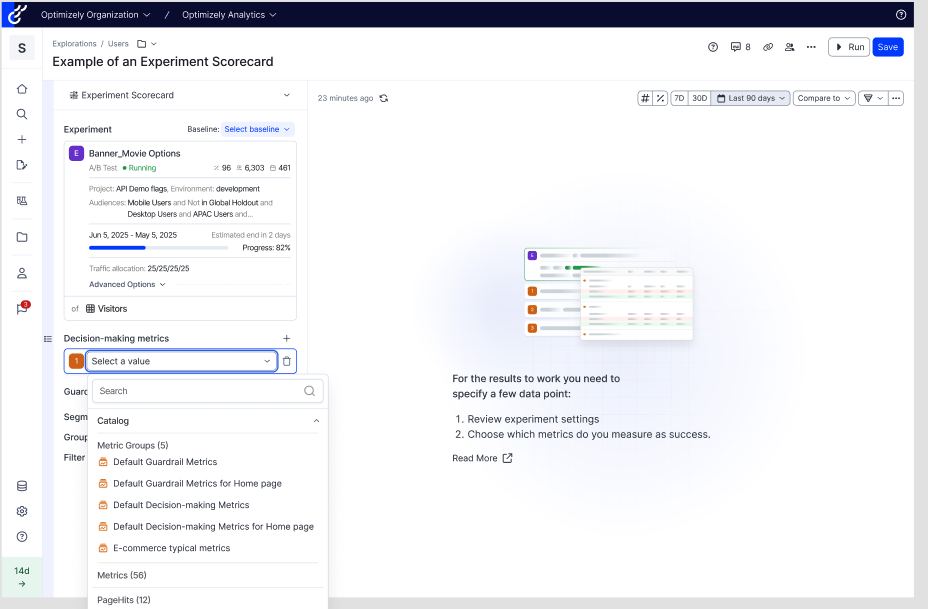
Images are for illustrative purposes and subject to change.
